Immigrants from Jamaica vs Immigrants from Argentina Householder Income Under 25 years
COMPARE
Immigrants from Jamaica
Immigrants from Argentina
Householder Income Under 25 years
Householder Income Under 25 years Comparison
Immigrants from Jamaica
Immigrants from Argentina
$51,038
HOUSEHOLDER INCOME UNDER 25 YEARS
5.6/ 100
METRIC RATING
225th/ 347
METRIC RANK
$54,209
HOUSEHOLDER INCOME UNDER 25 YEARS
99.3/ 100
METRIC RATING
93rd/ 347
METRIC RANK
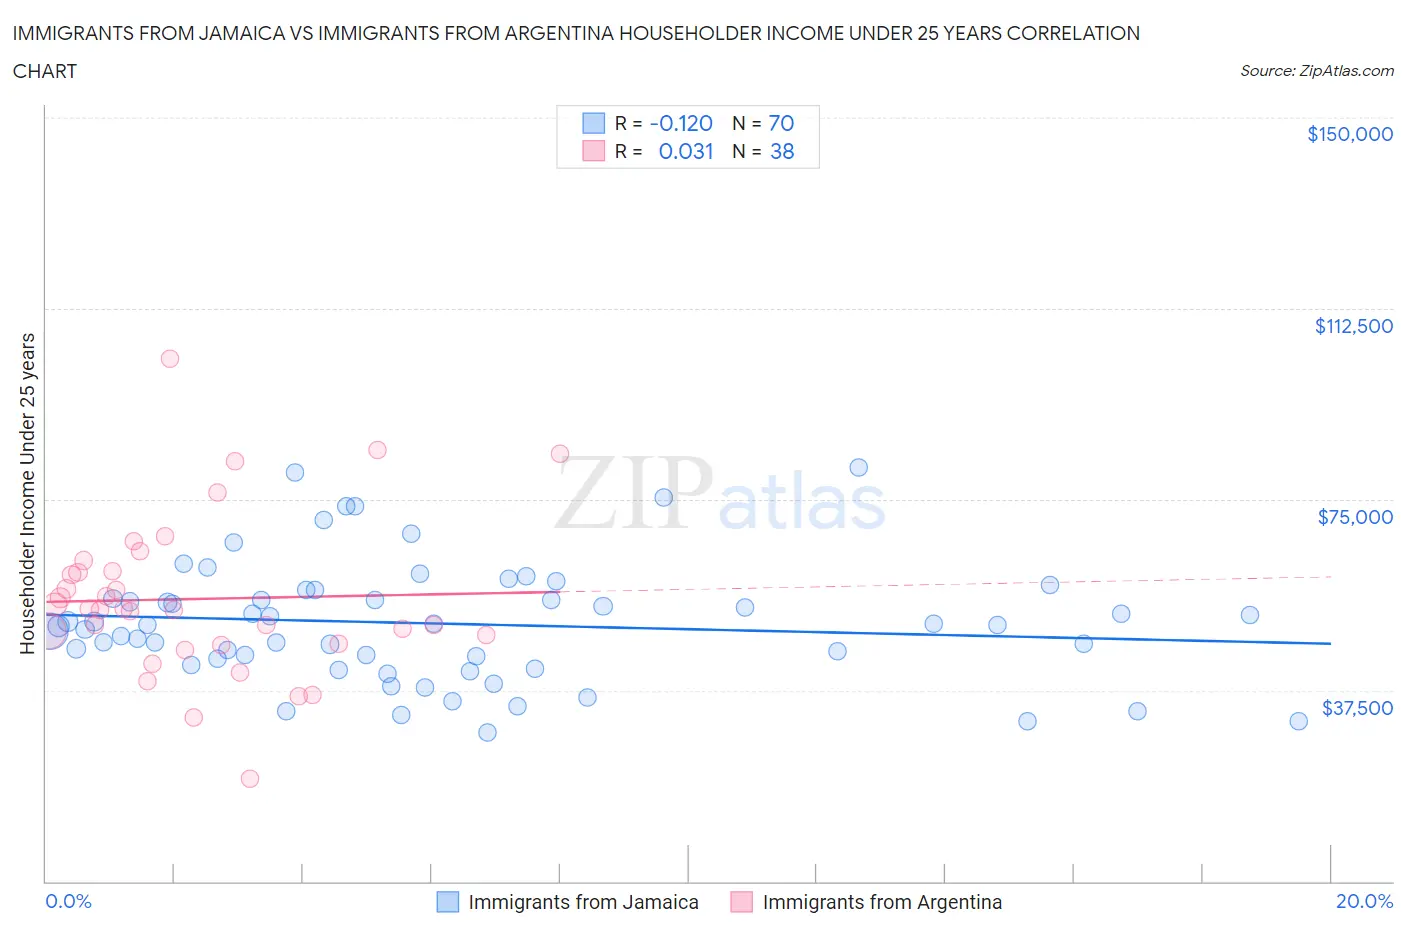
Immigrants from Jamaica vs Immigrants from Argentina Householder Income Under 25 years Correlation Chart
The statistical analysis conducted on geographies consisting of 257,803,816 people shows a poor negative correlation between the proportion of Immigrants from Jamaica and household income with householder under the age of 25 in the United States with a correlation coefficient (R) of -0.120 and weighted average of $51,038. Similarly, the statistical analysis conducted on geographies consisting of 229,141,308 people shows no correlation between the proportion of Immigrants from Argentina and household income with householder under the age of 25 in the United States with a correlation coefficient (R) of 0.031 and weighted average of $54,209, a difference of 6.2%.
Householder Income Under 25 years Correlation Summary
| Measurement | Immigrants from Jamaica | Immigrants from Argentina |
| Minimum | $29,211 | $20,094 |
| Maximum | $81,354 | $102,571 |
| Range | $52,143 | $82,477 |
| Mean | $50,619 | $55,432 |
| Median | $50,278 | $53,374 |
| Interquartile 25% (IQ1) | $43,769 | $46,727 |
| Interquartile 75% (IQ3) | $55,499 | $60,828 |
| Interquartile Range (IQR) | $11,730 | $14,101 |
| Standard Deviation (Sample) | $11,678 | $15,762 |
| Standard Deviation (Population) | $11,594 | $15,553 |
Similar Demographics by Householder Income Under 25 years
Demographics Similar to Immigrants from Jamaica by Householder Income Under 25 years
In terms of householder income under 25 years, the demographic groups most similar to Immigrants from Jamaica are Yugoslavian ($51,028, a difference of 0.020%), Immigrants from Central America ($51,022, a difference of 0.030%), Belizean ($51,094, a difference of 0.11%), Immigrants from Norway ($50,984, a difference of 0.11%), and Serbian ($51,106, a difference of 0.13%).
| Demographics | Rating | Rank | Householder Income Under 25 years |
| Immigrants | Belize | 8.6 /100 | #218 | Tragic $51,223 |
| Arabs | 8.5 /100 | #219 | Tragic $51,219 |
| Immigrants | Germany | 8.0 /100 | #220 | Tragic $51,190 |
| Immigrants | Eastern Africa | 7.4 /100 | #221 | Tragic $51,158 |
| Spaniards | 6.8 /100 | #222 | Tragic $51,117 |
| Serbians | 6.6 /100 | #223 | Tragic $51,106 |
| Belizeans | 6.4 /100 | #224 | Tragic $51,094 |
| Immigrants | Jamaica | 5.6 /100 | #225 | Tragic $51,038 |
| Yugoslavians | 5.5 /100 | #226 | Tragic $51,028 |
| Immigrants | Central America | 5.4 /100 | #227 | Tragic $51,022 |
| Immigrants | Norway | 5.0 /100 | #228 | Tragic $50,984 |
| Yuman | 4.4 /100 | #229 | Tragic $50,933 |
| Jamaicans | 4.4 /100 | #230 | Tragic $50,929 |
| Ugandans | 4.3 /100 | #231 | Tragic $50,923 |
| Slovenes | 4.0 /100 | #232 | Tragic $50,886 |
Demographics Similar to Immigrants from Argentina by Householder Income Under 25 years
In terms of householder income under 25 years, the demographic groups most similar to Immigrants from Argentina are Immigrants from Sierra Leone ($54,190, a difference of 0.030%), Immigrants from St. Vincent and the Grenadines ($54,230, a difference of 0.040%), Immigrants from Egypt ($54,239, a difference of 0.050%), Immigrants from Malaysia ($54,179, a difference of 0.050%), and Turkish ($54,266, a difference of 0.10%).
| Demographics | Rating | Rank | Householder Income Under 25 years |
| Immigrants | Croatia | 99.5 /100 | #86 | Exceptional $54,343 |
| Brazilians | 99.5 /100 | #87 | Exceptional $54,335 |
| Yakama | 99.5 /100 | #88 | Exceptional $54,321 |
| Immigrants | South America | 99.4 /100 | #89 | Exceptional $54,268 |
| Turks | 99.4 /100 | #90 | Exceptional $54,266 |
| Immigrants | Egypt | 99.3 /100 | #91 | Exceptional $54,239 |
| Immigrants | St. Vincent and the Grenadines | 99.3 /100 | #92 | Exceptional $54,230 |
| Immigrants | Argentina | 99.3 /100 | #93 | Exceptional $54,209 |
| Immigrants | Sierra Leone | 99.3 /100 | #94 | Exceptional $54,190 |
| Immigrants | Malaysia | 99.2 /100 | #95 | Exceptional $54,179 |
| Argentineans | 99.2 /100 | #96 | Exceptional $54,154 |
| Immigrants | Portugal | 99.1 /100 | #97 | Exceptional $54,105 |
| Eastern Europeans | 99.0 /100 | #98 | Exceptional $54,066 |
| Alaska Natives | 98.8 /100 | #99 | Exceptional $54,000 |
| Immigrants | Kazakhstan | 98.8 /100 | #100 | Exceptional $53,990 |