Immigrants from Jamaica vs Immigrants from Argentina Unemployment Among Seniors over 65 years
COMPARE
Immigrants from Jamaica
Immigrants from Argentina
Unemployment Among Seniors over 65 years
Unemployment Among Seniors over 65 years Comparison
Immigrants from Jamaica
Immigrants from Argentina
5.4%
UNEMPLOYMENT AMONG SENIORS OVER 65 YEARS
0.1/ 100
METRIC RATING
272nd/ 347
METRIC RANK
5.3%
UNEMPLOYMENT AMONG SENIORS OVER 65 YEARS
4.0/ 100
METRIC RATING
230th/ 347
METRIC RANK
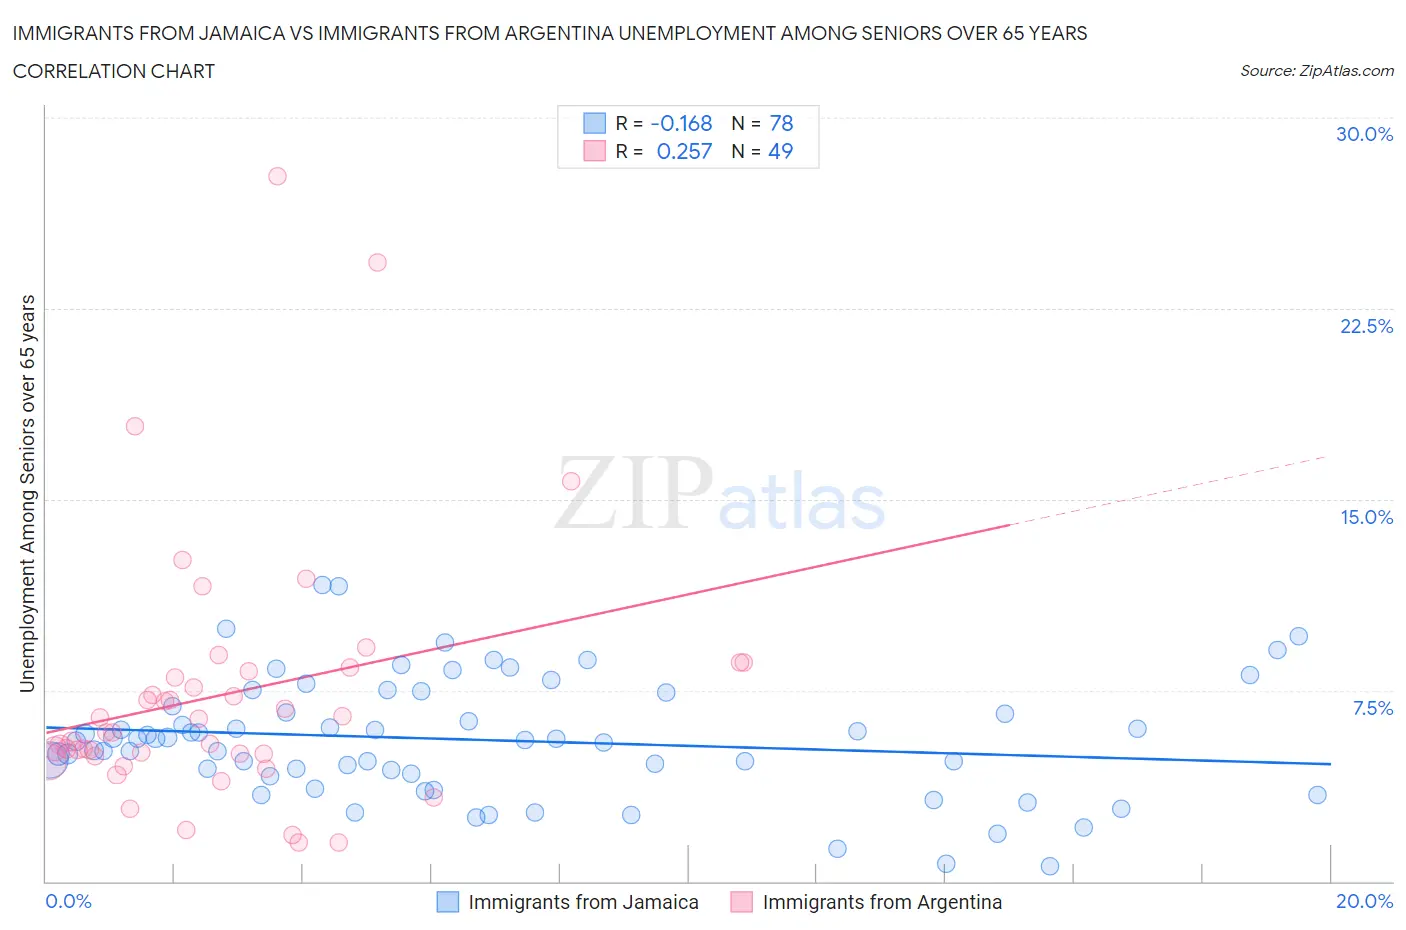
Immigrants from Jamaica vs Immigrants from Argentina Unemployment Among Seniors over 65 years Correlation Chart
The statistical analysis conducted on geographies consisting of 278,648,616 people shows a poor negative correlation between the proportion of Immigrants from Jamaica and unemployment rate amomg seniors over the age of 65 in the United States with a correlation coefficient (R) of -0.168 and weighted average of 5.4%. Similarly, the statistical analysis conducted on geographies consisting of 249,297,697 people shows a weak positive correlation between the proportion of Immigrants from Argentina and unemployment rate amomg seniors over the age of 65 in the United States with a correlation coefficient (R) of 0.257 and weighted average of 5.3%, a difference of 2.8%.
Unemployment Among Seniors over 65 years Correlation Summary
| Measurement | Immigrants from Jamaica | Immigrants from Argentina |
| Minimum | 0.60% | 1.5% |
| Maximum | 11.6% | 27.7% |
| Range | 11.0% | 26.2% |
| Mean | 5.6% | 7.3% |
| Median | 5.6% | 5.8% |
| Interquartile 25% (IQ1) | 4.2% | 5.0% |
| Interquartile 75% (IQ3) | 6.9% | 8.3% |
| Interquartile Range (IQR) | 2.7% | 3.4% |
| Standard Deviation (Sample) | 2.3% | 5.1% |
| Standard Deviation (Population) | 2.3% | 5.0% |
Similar Demographics by Unemployment Among Seniors over 65 years
Demographics Similar to Immigrants from Jamaica by Unemployment Among Seniors over 65 years
In terms of unemployment among seniors over 65 years, the demographic groups most similar to Immigrants from Jamaica are Cypriot (5.4%, a difference of 0.0%), Immigrants from Morocco (5.4%, a difference of 0.010%), Immigrants from Nigeria (5.4%, a difference of 0.010%), Immigrants from Brazil (5.4%, a difference of 0.050%), and Immigrants from Southern Europe (5.4%, a difference of 0.080%).
| Demographics | Rating | Rank | Unemployment Among Seniors over 65 years |
| Immigrants | Colombia | 0.2 /100 | #265 | Tragic 5.4% |
| Pennsylvania Germans | 0.2 /100 | #266 | Tragic 5.4% |
| Chippewa | 0.2 /100 | #267 | Tragic 5.4% |
| Hawaiians | 0.1 /100 | #268 | Tragic 5.4% |
| Immigrants | Southern Europe | 0.1 /100 | #269 | Tragic 5.4% |
| Immigrants | Morocco | 0.1 /100 | #270 | Tragic 5.4% |
| Cypriots | 0.1 /100 | #271 | Tragic 5.4% |
| Immigrants | Jamaica | 0.1 /100 | #272 | Tragic 5.4% |
| Immigrants | Nigeria | 0.1 /100 | #273 | Tragic 5.4% |
| Immigrants | Brazil | 0.1 /100 | #274 | Tragic 5.4% |
| Mexican American Indians | 0.1 /100 | #275 | Tragic 5.4% |
| Pueblo | 0.1 /100 | #276 | Tragic 5.4% |
| Immigrants | Western Africa | 0.1 /100 | #277 | Tragic 5.4% |
| Colville | 0.1 /100 | #278 | Tragic 5.4% |
| Brazilians | 0.1 /100 | #279 | Tragic 5.5% |
Demographics Similar to Immigrants from Argentina by Unemployment Among Seniors over 65 years
In terms of unemployment among seniors over 65 years, the demographic groups most similar to Immigrants from Argentina are Hungarian (5.3%, a difference of 0.030%), Samoan (5.3%, a difference of 0.040%), Haitian (5.3%, a difference of 0.070%), Hopi (5.3%, a difference of 0.11%), and Marshallese (5.3%, a difference of 0.20%).
| Demographics | Rating | Rank | Unemployment Among Seniors over 65 years |
| Cree | 5.8 /100 | #223 | Tragic 5.3% |
| Immigrants | Syria | 5.6 /100 | #224 | Tragic 5.3% |
| Hondurans | 5.6 /100 | #225 | Tragic 5.3% |
| Immigrants | Croatia | 5.3 /100 | #226 | Tragic 5.3% |
| French American Indians | 5.2 /100 | #227 | Tragic 5.3% |
| Haitians | 4.4 /100 | #228 | Tragic 5.3% |
| Samoans | 4.2 /100 | #229 | Tragic 5.3% |
| Immigrants | Argentina | 4.0 /100 | #230 | Tragic 5.3% |
| Hungarians | 3.9 /100 | #231 | Tragic 5.3% |
| Hopi | 3.5 /100 | #232 | Tragic 5.3% |
| Marshallese | 3.1 /100 | #233 | Tragic 5.3% |
| Blackfeet | 3.1 /100 | #234 | Tragic 5.3% |
| Immigrants | Albania | 2.7 /100 | #235 | Tragic 5.3% |
| Immigrants | Costa Rica | 2.1 /100 | #236 | Tragic 5.3% |
| Immigrants | Greece | 2.0 /100 | #237 | Tragic 5.3% |