Immigrants from Jamaica vs Estonian Kindergarten
COMPARE
Immigrants from Jamaica
Estonian
Kindergarten
Kindergarten Comparison
Immigrants from Jamaica
Estonians
97.5%
KINDERGARTEN
0.2/ 100
METRIC RATING
270th/ 347
METRIC RANK
98.4%
KINDERGARTEN
99.8/ 100
METRIC RATING
51st/ 347
METRIC RANK
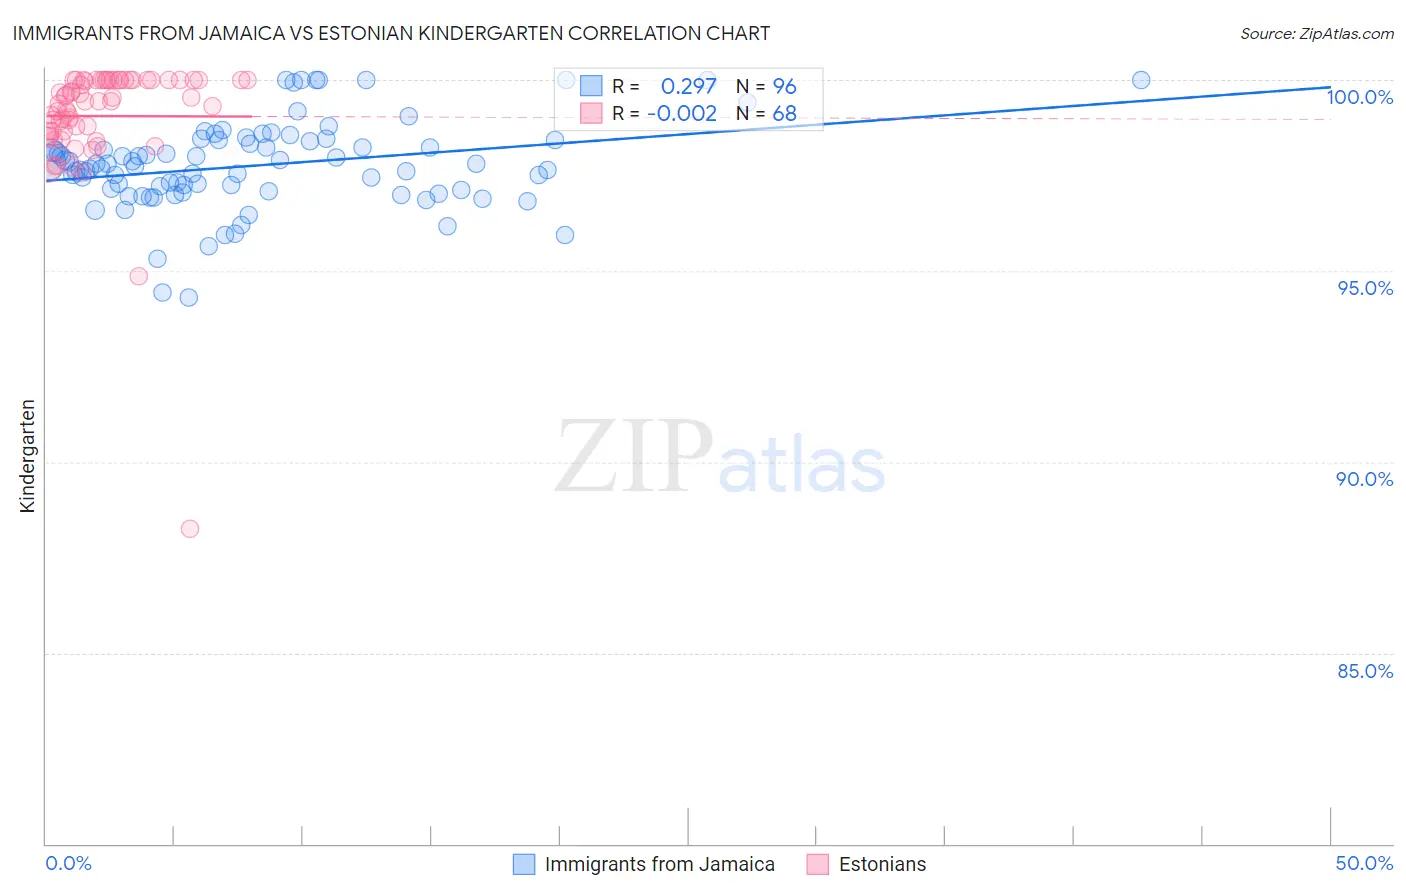
Immigrants from Jamaica vs Estonian Kindergarten Correlation Chart
The statistical analysis conducted on geographies consisting of 301,830,081 people shows a weak positive correlation between the proportion of Immigrants from Jamaica and percentage of population with at least kindergarten education in the United States with a correlation coefficient (R) of 0.297 and weighted average of 97.5%. Similarly, the statistical analysis conducted on geographies consisting of 123,528,404 people shows no correlation between the proportion of Estonians and percentage of population with at least kindergarten education in the United States with a correlation coefficient (R) of -0.002 and weighted average of 98.4%, a difference of 0.96%.
Kindergarten Correlation Summary
| Measurement | Immigrants from Jamaica | Estonian |
| Minimum | 94.3% | 88.3% |
| Maximum | 100.0% | 100.0% |
| Range | 5.7% | 11.7% |
| Mean | 97.8% | 99.1% |
| Median | 97.8% | 99.4% |
| Interquartile 25% (IQ1) | 97.1% | 98.7% |
| Interquartile 75% (IQ3) | 98.4% | 100.0% |
| Interquartile Range (IQR) | 1.3% | 1.3% |
| Standard Deviation (Sample) | 1.1% | 1.6% |
| Standard Deviation (Population) | 1.1% | 1.6% |
Similar Demographics by Kindergarten
Demographics Similar to Immigrants from Jamaica by Kindergarten
In terms of kindergarten, the demographic groups most similar to Immigrants from Jamaica are West Indian (97.5%, a difference of 0.020%), Immigrants from Peru (97.5%, a difference of 0.020%), Immigrants from Bolivia (97.5%, a difference of 0.020%), Cuban (97.5%, a difference of 0.030%), and Immigrants from Sierra Leone (97.5%, a difference of 0.030%).
| Demographics | Rating | Rank | Kindergarten |
| Immigrants | South America | 0.4 /100 | #263 | Tragic 97.5% |
| Assyrians/Chaldeans/Syriacs | 0.4 /100 | #264 | Tragic 97.5% |
| Cubans | 0.3 /100 | #265 | Tragic 97.5% |
| Immigrants | Sierra Leone | 0.3 /100 | #266 | Tragic 97.5% |
| Immigrants | Liberia | 0.3 /100 | #267 | Tragic 97.5% |
| Immigrants | Nigeria | 0.3 /100 | #268 | Tragic 97.5% |
| West Indians | 0.3 /100 | #269 | Tragic 97.5% |
| Immigrants | Jamaica | 0.2 /100 | #270 | Tragic 97.5% |
| Immigrants | Peru | 0.2 /100 | #271 | Tragic 97.5% |
| Immigrants | Bolivia | 0.2 /100 | #272 | Tragic 97.5% |
| Immigrants | China | 0.1 /100 | #273 | Tragic 97.4% |
| Immigrants | Cameroon | 0.1 /100 | #274 | Tragic 97.4% |
| Ghanaians | 0.1 /100 | #275 | Tragic 97.4% |
| Immigrants | Philippines | 0.1 /100 | #276 | Tragic 97.4% |
| Immigrants | Western Africa | 0.1 /100 | #277 | Tragic 97.4% |
Demographics Similar to Estonians by Kindergarten
In terms of kindergarten, the demographic groups most similar to Estonians are Kiowa (98.4%, a difference of 0.0%), White/Caucasian (98.4%, a difference of 0.0%), Australian (98.4%, a difference of 0.0%), Celtic (98.4%, a difference of 0.0%), and Pueblo (98.4%, a difference of 0.0%).
| Demographics | Rating | Rank | Kindergarten |
| Northern Europeans | 99.9 /100 | #44 | Exceptional 98.5% |
| Belgians | 99.9 /100 | #45 | Exceptional 98.5% |
| Hungarians | 99.9 /100 | #46 | Exceptional 98.5% |
| Czechoslovakians | 99.8 /100 | #47 | Exceptional 98.4% |
| Ottawa | 99.8 /100 | #48 | Exceptional 98.4% |
| Kiowa | 99.8 /100 | #49 | Exceptional 98.4% |
| Whites/Caucasians | 99.8 /100 | #50 | Exceptional 98.4% |
| Estonians | 99.8 /100 | #51 | Exceptional 98.4% |
| Australians | 99.8 /100 | #52 | Exceptional 98.4% |
| Celtics | 99.8 /100 | #53 | Exceptional 98.4% |
| Pueblo | 99.8 /100 | #54 | Exceptional 98.4% |
| Immigrants | Scotland | 99.8 /100 | #55 | Exceptional 98.4% |
| Americans | 99.8 /100 | #56 | Exceptional 98.4% |
| Austrians | 99.8 /100 | #57 | Exceptional 98.4% |
| Bulgarians | 99.7 /100 | #58 | Exceptional 98.4% |