Immigrants from Cuba vs Estonian Kindergarten
COMPARE
Immigrants from Cuba
Estonian
Kindergarten
Kindergarten Comparison
Immigrants from Cuba
Estonians
97.1%
KINDERGARTEN
0.0/ 100
METRIC RATING
299th/ 347
METRIC RANK
98.4%
KINDERGARTEN
99.8/ 100
METRIC RATING
51st/ 347
METRIC RANK
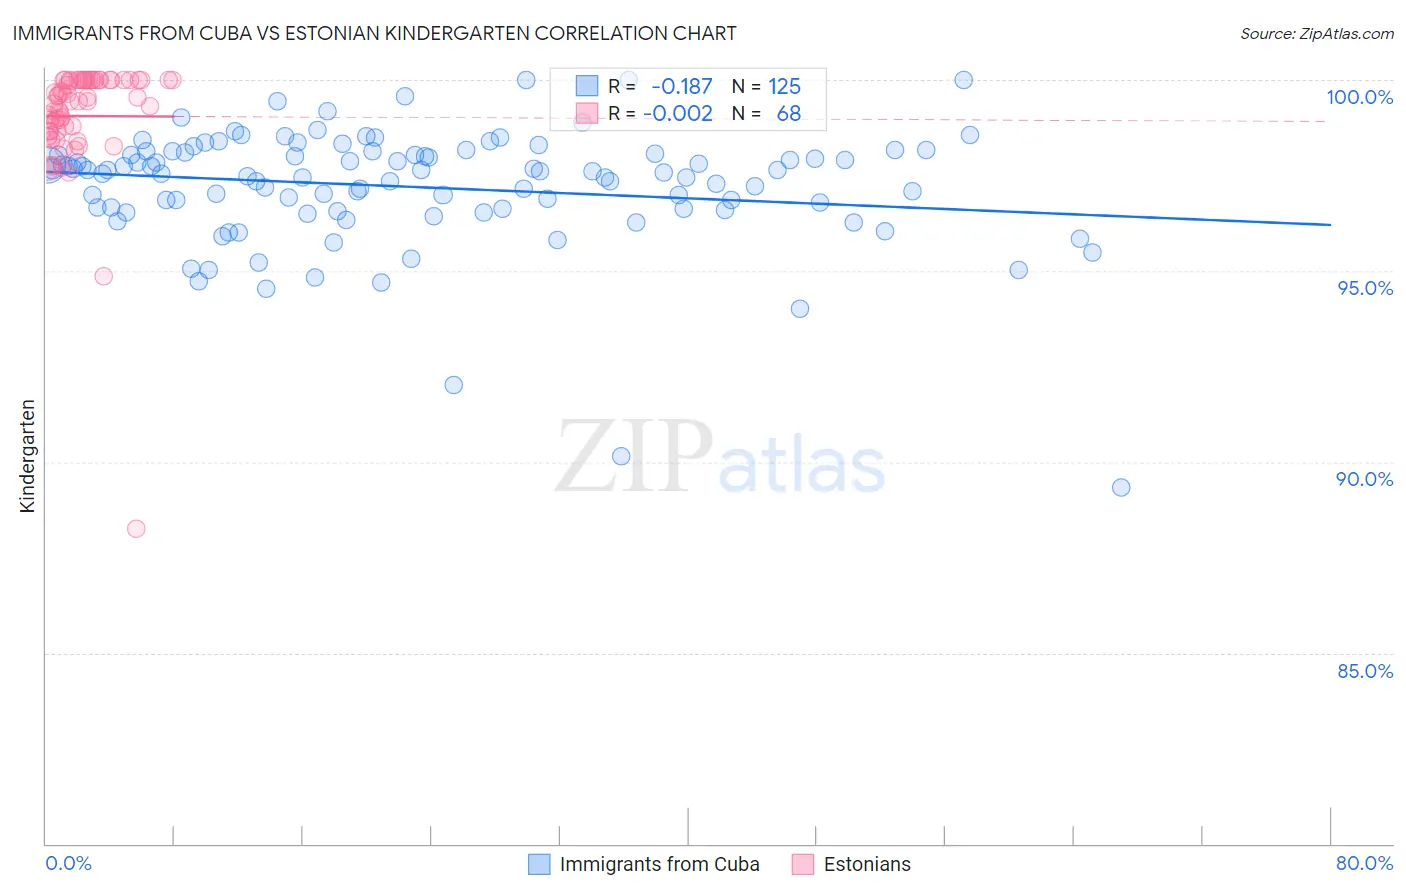
Immigrants from Cuba vs Estonian Kindergarten Correlation Chart
The statistical analysis conducted on geographies consisting of 326,028,159 people shows a poor negative correlation between the proportion of Immigrants from Cuba and percentage of population with at least kindergarten education in the United States with a correlation coefficient (R) of -0.187 and weighted average of 97.1%. Similarly, the statistical analysis conducted on geographies consisting of 123,528,404 people shows no correlation between the proportion of Estonians and percentage of population with at least kindergarten education in the United States with a correlation coefficient (R) of -0.002 and weighted average of 98.4%, a difference of 1.3%.
Kindergarten Correlation Summary
| Measurement | Immigrants from Cuba | Estonian |
| Minimum | 89.3% | 88.3% |
| Maximum | 100.0% | 100.0% |
| Range | 10.7% | 11.7% |
| Mean | 97.2% | 99.1% |
| Median | 97.6% | 99.4% |
| Interquartile 25% (IQ1) | 96.6% | 98.7% |
| Interquartile 75% (IQ3) | 98.1% | 100.0% |
| Interquartile Range (IQR) | 1.5% | 1.3% |
| Standard Deviation (Sample) | 1.6% | 1.6% |
| Standard Deviation (Population) | 1.6% | 1.6% |
Similar Demographics by Kindergarten
Demographics Similar to Immigrants from Cuba by Kindergarten
In terms of kindergarten, the demographic groups most similar to Immigrants from Cuba are Immigrants from Dominica (97.1%, a difference of 0.010%), Haitian (97.1%, a difference of 0.010%), Central American Indian (97.2%, a difference of 0.030%), Immigrants from South Eastern Asia (97.1%, a difference of 0.030%), and Immigrants from Caribbean (97.1%, a difference of 0.060%).
| Demographics | Rating | Rank | Kindergarten |
| British West Indians | 0.0 /100 | #292 | Tragic 97.3% |
| Malaysians | 0.0 /100 | #293 | Tragic 97.2% |
| Immigrants | Immigrants | 0.0 /100 | #294 | Tragic 97.2% |
| Immigrants | Grenada | 0.0 /100 | #295 | Tragic 97.2% |
| Immigrants | Eritrea | 0.0 /100 | #296 | Tragic 97.2% |
| Central American Indians | 0.0 /100 | #297 | Tragic 97.2% |
| Immigrants | Dominica | 0.0 /100 | #298 | Tragic 97.1% |
| Immigrants | Cuba | 0.0 /100 | #299 | Tragic 97.1% |
| Haitians | 0.0 /100 | #300 | Tragic 97.1% |
| Immigrants | South Eastern Asia | 0.0 /100 | #301 | Tragic 97.1% |
| Immigrants | Caribbean | 0.0 /100 | #302 | Tragic 97.1% |
| Somalis | 0.0 /100 | #303 | Tragic 97.0% |
| Nicaraguans | 0.0 /100 | #304 | Tragic 97.0% |
| Ecuadorians | 0.0 /100 | #305 | Tragic 97.0% |
| Belizeans | 0.0 /100 | #306 | Tragic 97.0% |
Demographics Similar to Estonians by Kindergarten
In terms of kindergarten, the demographic groups most similar to Estonians are Kiowa (98.4%, a difference of 0.0%), White/Caucasian (98.4%, a difference of 0.0%), Australian (98.4%, a difference of 0.0%), Celtic (98.4%, a difference of 0.0%), and Pueblo (98.4%, a difference of 0.0%).
| Demographics | Rating | Rank | Kindergarten |
| Northern Europeans | 99.9 /100 | #44 | Exceptional 98.5% |
| Belgians | 99.9 /100 | #45 | Exceptional 98.5% |
| Hungarians | 99.9 /100 | #46 | Exceptional 98.5% |
| Czechoslovakians | 99.8 /100 | #47 | Exceptional 98.4% |
| Ottawa | 99.8 /100 | #48 | Exceptional 98.4% |
| Kiowa | 99.8 /100 | #49 | Exceptional 98.4% |
| Whites/Caucasians | 99.8 /100 | #50 | Exceptional 98.4% |
| Estonians | 99.8 /100 | #51 | Exceptional 98.4% |
| Australians | 99.8 /100 | #52 | Exceptional 98.4% |
| Celtics | 99.8 /100 | #53 | Exceptional 98.4% |
| Pueblo | 99.8 /100 | #54 | Exceptional 98.4% |
| Immigrants | Scotland | 99.8 /100 | #55 | Exceptional 98.4% |
| Americans | 99.8 /100 | #56 | Exceptional 98.4% |
| Austrians | 99.8 /100 | #57 | Exceptional 98.4% |
| Bulgarians | 99.7 /100 | #58 | Exceptional 98.4% |