Immigrants from Jamaica vs Korean Kindergarten
COMPARE
Immigrants from Jamaica
Korean
Kindergarten
Kindergarten Comparison
Immigrants from Jamaica
Koreans
97.5%
KINDERGARTEN
0.2/ 100
METRIC RATING
270th/ 347
METRIC RANK
97.6%
KINDERGARTEN
1.6/ 100
METRIC RATING
240th/ 347
METRIC RANK
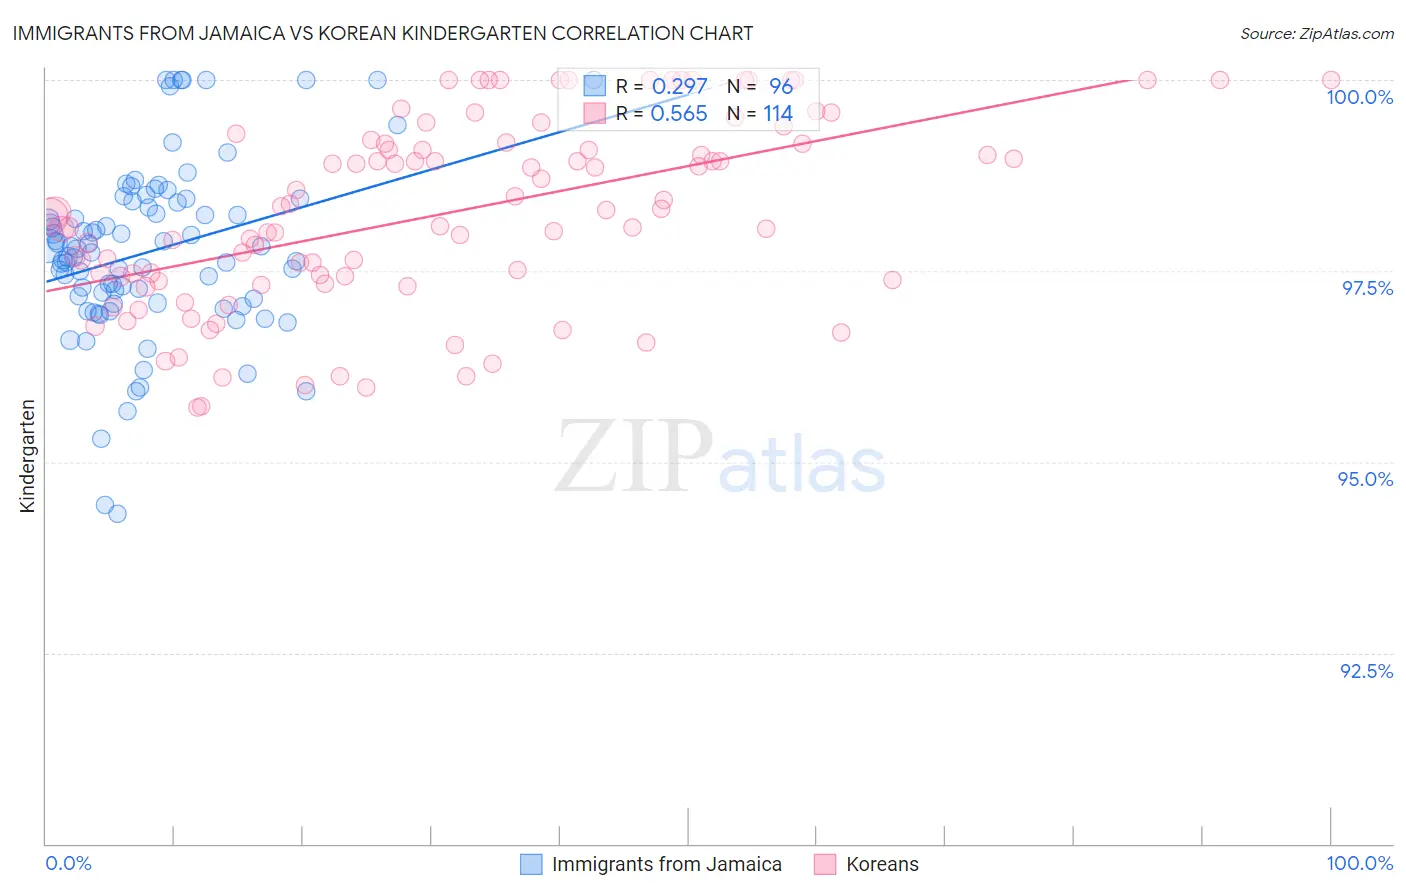
Immigrants from Jamaica vs Korean Kindergarten Correlation Chart
The statistical analysis conducted on geographies consisting of 301,830,081 people shows a weak positive correlation between the proportion of Immigrants from Jamaica and percentage of population with at least kindergarten education in the United States with a correlation coefficient (R) of 0.297 and weighted average of 97.5%. Similarly, the statistical analysis conducted on geographies consisting of 510,935,951 people shows a substantial positive correlation between the proportion of Koreans and percentage of population with at least kindergarten education in the United States with a correlation coefficient (R) of 0.565 and weighted average of 97.6%, a difference of 0.16%.
Kindergarten Correlation Summary
| Measurement | Immigrants from Jamaica | Korean |
| Minimum | 94.3% | 95.7% |
| Maximum | 100.0% | 100.0% |
| Range | 5.7% | 4.3% |
| Mean | 97.8% | 98.2% |
| Median | 97.8% | 98.2% |
| Interquartile 25% (IQ1) | 97.1% | 97.4% |
| Interquartile 75% (IQ3) | 98.4% | 99.2% |
| Interquartile Range (IQR) | 1.3% | 1.8% |
| Standard Deviation (Sample) | 1.1% | 1.2% |
| Standard Deviation (Population) | 1.1% | 1.2% |
Similar Demographics by Kindergarten
Demographics Similar to Immigrants from Jamaica by Kindergarten
In terms of kindergarten, the demographic groups most similar to Immigrants from Jamaica are West Indian (97.5%, a difference of 0.020%), Immigrants from Peru (97.5%, a difference of 0.020%), Immigrants from Bolivia (97.5%, a difference of 0.020%), Cuban (97.5%, a difference of 0.030%), and Immigrants from Sierra Leone (97.5%, a difference of 0.030%).
| Demographics | Rating | Rank | Kindergarten |
| Immigrants | South America | 0.4 /100 | #263 | Tragic 97.5% |
| Assyrians/Chaldeans/Syriacs | 0.4 /100 | #264 | Tragic 97.5% |
| Cubans | 0.3 /100 | #265 | Tragic 97.5% |
| Immigrants | Sierra Leone | 0.3 /100 | #266 | Tragic 97.5% |
| Immigrants | Liberia | 0.3 /100 | #267 | Tragic 97.5% |
| Immigrants | Nigeria | 0.3 /100 | #268 | Tragic 97.5% |
| West Indians | 0.3 /100 | #269 | Tragic 97.5% |
| Immigrants | Jamaica | 0.2 /100 | #270 | Tragic 97.5% |
| Immigrants | Peru | 0.2 /100 | #271 | Tragic 97.5% |
| Immigrants | Bolivia | 0.2 /100 | #272 | Tragic 97.5% |
| Immigrants | China | 0.1 /100 | #273 | Tragic 97.4% |
| Immigrants | Cameroon | 0.1 /100 | #274 | Tragic 97.4% |
| Ghanaians | 0.1 /100 | #275 | Tragic 97.4% |
| Immigrants | Philippines | 0.1 /100 | #276 | Tragic 97.4% |
| Immigrants | Western Africa | 0.1 /100 | #277 | Tragic 97.4% |
Demographics Similar to Koreans by Kindergarten
In terms of kindergarten, the demographic groups most similar to Koreans are Nigerian (97.6%, a difference of 0.010%), Immigrants from Eastern Asia (97.6%, a difference of 0.010%), U.S. Virgin Islander (97.6%, a difference of 0.010%), Immigrants from Malaysia (97.7%, a difference of 0.020%), and Colombian (97.7%, a difference of 0.020%).
| Demographics | Rating | Rank | Kindergarten |
| Immigrants | Pakistan | 2.2 /100 | #233 | Tragic 97.7% |
| Immigrants | Malaysia | 2.2 /100 | #234 | Tragic 97.7% |
| Colombians | 2.2 /100 | #235 | Tragic 97.7% |
| Immigrants | Western Asia | 2.1 /100 | #236 | Tragic 97.7% |
| Nigerians | 1.8 /100 | #237 | Tragic 97.6% |
| Immigrants | Eastern Asia | 1.7 /100 | #238 | Tragic 97.6% |
| U.S. Virgin Islanders | 1.7 /100 | #239 | Tragic 97.6% |
| Koreans | 1.6 /100 | #240 | Tragic 97.6% |
| Liberians | 1.3 /100 | #241 | Tragic 97.6% |
| Immigrants | Indonesia | 1.3 /100 | #242 | Tragic 97.6% |
| Asians | 1.2 /100 | #243 | Tragic 97.6% |
| Bolivians | 1.2 /100 | #244 | Tragic 97.6% |
| South Americans | 1.1 /100 | #245 | Tragic 97.6% |
| Indians (Asian) | 1.0 /100 | #246 | Tragic 97.6% |
| Immigrants | Eastern Africa | 1.0 /100 | #247 | Tragic 97.6% |