Immigrants from Somalia vs Delaware 9th Grade
COMPARE
Immigrants from Somalia
Delaware
9th Grade
9th Grade Comparison
Immigrants from Somalia
Delaware
94.1%
9TH GRADE
1.4/ 100
METRIC RATING
248th/ 347
METRIC RANK
95.6%
9TH GRADE
98.4/ 100
METRIC RATING
97th/ 347
METRIC RANK
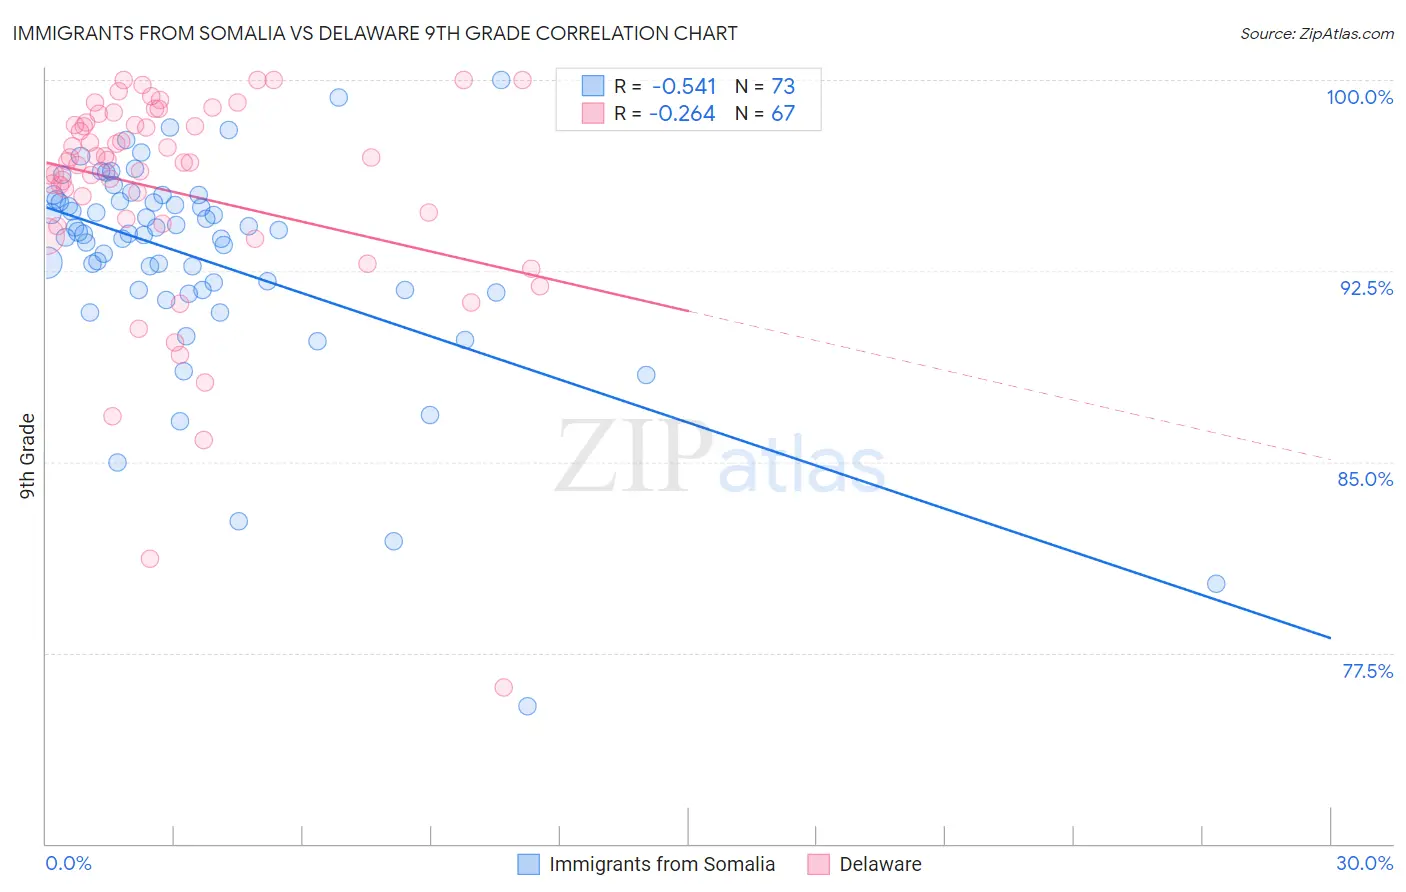
Immigrants from Somalia vs Delaware 9th Grade Correlation Chart
The statistical analysis conducted on geographies consisting of 92,097,499 people shows a substantial negative correlation between the proportion of Immigrants from Somalia and percentage of population with at least 9th grade education in the United States with a correlation coefficient (R) of -0.541 and weighted average of 94.1%. Similarly, the statistical analysis conducted on geographies consisting of 96,234,866 people shows a weak negative correlation between the proportion of Delaware and percentage of population with at least 9th grade education in the United States with a correlation coefficient (R) of -0.264 and weighted average of 95.6%, a difference of 1.5%.
9th Grade Correlation Summary
| Measurement | Immigrants from Somalia | Delaware |
| Minimum | 75.4% | 76.1% |
| Maximum | 100.0% | 100.0% |
| Range | 24.6% | 23.9% |
| Mean | 93.0% | 95.6% |
| Median | 94.0% | 96.8% |
| Interquartile 25% (IQ1) | 91.7% | 94.3% |
| Interquartile 75% (IQ3) | 95.3% | 98.3% |
| Interquartile Range (IQR) | 3.5% | 4.0% |
| Standard Deviation (Sample) | 4.2% | 4.5% |
| Standard Deviation (Population) | 4.2% | 4.4% |
Similar Demographics by 9th Grade
Demographics Similar to Immigrants from Somalia by 9th Grade
In terms of 9th grade, the demographic groups most similar to Immigrants from Somalia are Uruguayan (94.1%, a difference of 0.010%), Immigrants from Hong Kong (94.1%, a difference of 0.010%), Senegalese (94.2%, a difference of 0.050%), Afghan (94.2%, a difference of 0.050%), and Paiute (94.2%, a difference of 0.060%).
| Demographics | Rating | Rank | 9th Grade |
| Spanish Americans | 2.6 /100 | #241 | Tragic 94.2% |
| Immigrants | Middle Africa | 2.2 /100 | #242 | Tragic 94.2% |
| Immigrants | Cameroon | 2.1 /100 | #243 | Tragic 94.2% |
| Dutch West Indians | 2.0 /100 | #244 | Tragic 94.2% |
| Paiute | 1.9 /100 | #245 | Tragic 94.2% |
| Senegalese | 1.9 /100 | #246 | Tragic 94.2% |
| Afghans | 1.8 /100 | #247 | Tragic 94.2% |
| Immigrants | Somalia | 1.4 /100 | #248 | Tragic 94.1% |
| Uruguayans | 1.3 /100 | #249 | Tragic 94.1% |
| Immigrants | Hong Kong | 1.3 /100 | #250 | Tragic 94.1% |
| Jamaicans | 1.0 /100 | #251 | Tragic 94.1% |
| Immigrants | Senegal | 0.9 /100 | #252 | Tragic 94.1% |
| Colombians | 0.8 /100 | #253 | Tragic 94.0% |
| U.S. Virgin Islanders | 0.7 /100 | #254 | Tragic 94.0% |
| Immigrants | Nigeria | 0.6 /100 | #255 | Tragic 94.0% |
Demographics Similar to Delaware by 9th Grade
In terms of 9th grade, the demographic groups most similar to Delaware are Filipino (95.6%, a difference of 0.0%), American (95.6%, a difference of 0.010%), Immigrants from Japan (95.6%, a difference of 0.010%), Menominee (95.6%, a difference of 0.010%), and Immigrants from Germany (95.6%, a difference of 0.030%).
| Demographics | Rating | Rank | 9th Grade |
| South Africans | 98.8 /100 | #90 | Exceptional 95.6% |
| Creek | 98.8 /100 | #91 | Exceptional 95.6% |
| Immigrants | Saudi Arabia | 98.8 /100 | #92 | Exceptional 95.6% |
| Immigrants | Germany | 98.7 /100 | #93 | Exceptional 95.6% |
| Immigrants | Latvia | 98.7 /100 | #94 | Exceptional 95.6% |
| Americans | 98.5 /100 | #95 | Exceptional 95.6% |
| Filipinos | 98.5 /100 | #96 | Exceptional 95.6% |
| Delaware | 98.4 /100 | #97 | Exceptional 95.6% |
| Immigrants | Japan | 98.4 /100 | #98 | Exceptional 95.6% |
| Menominee | 98.3 /100 | #99 | Exceptional 95.6% |
| Lebanese | 98.1 /100 | #100 | Exceptional 95.6% |
| Immigrants | Moldova | 97.9 /100 | #101 | Exceptional 95.5% |
| Immigrants | Switzerland | 97.7 /100 | #102 | Exceptional 95.5% |
| Potawatomi | 97.7 /100 | #103 | Exceptional 95.5% |
| Syrians | 97.4 /100 | #104 | Exceptional 95.5% |