Immigrants from Israel vs Immigrants from Jamaica Nursery School
COMPARE
Immigrants from Israel
Immigrants from Jamaica
Nursery School
Nursery School Comparison
Immigrants from Israel
Immigrants from Jamaica
98.1%
NURSERY SCHOOL
78.5/ 100
METRIC RATING
145th/ 347
METRIC RANK
97.5%
NURSERY SCHOOL
0.2/ 100
METRIC RATING
270th/ 347
METRIC RANK
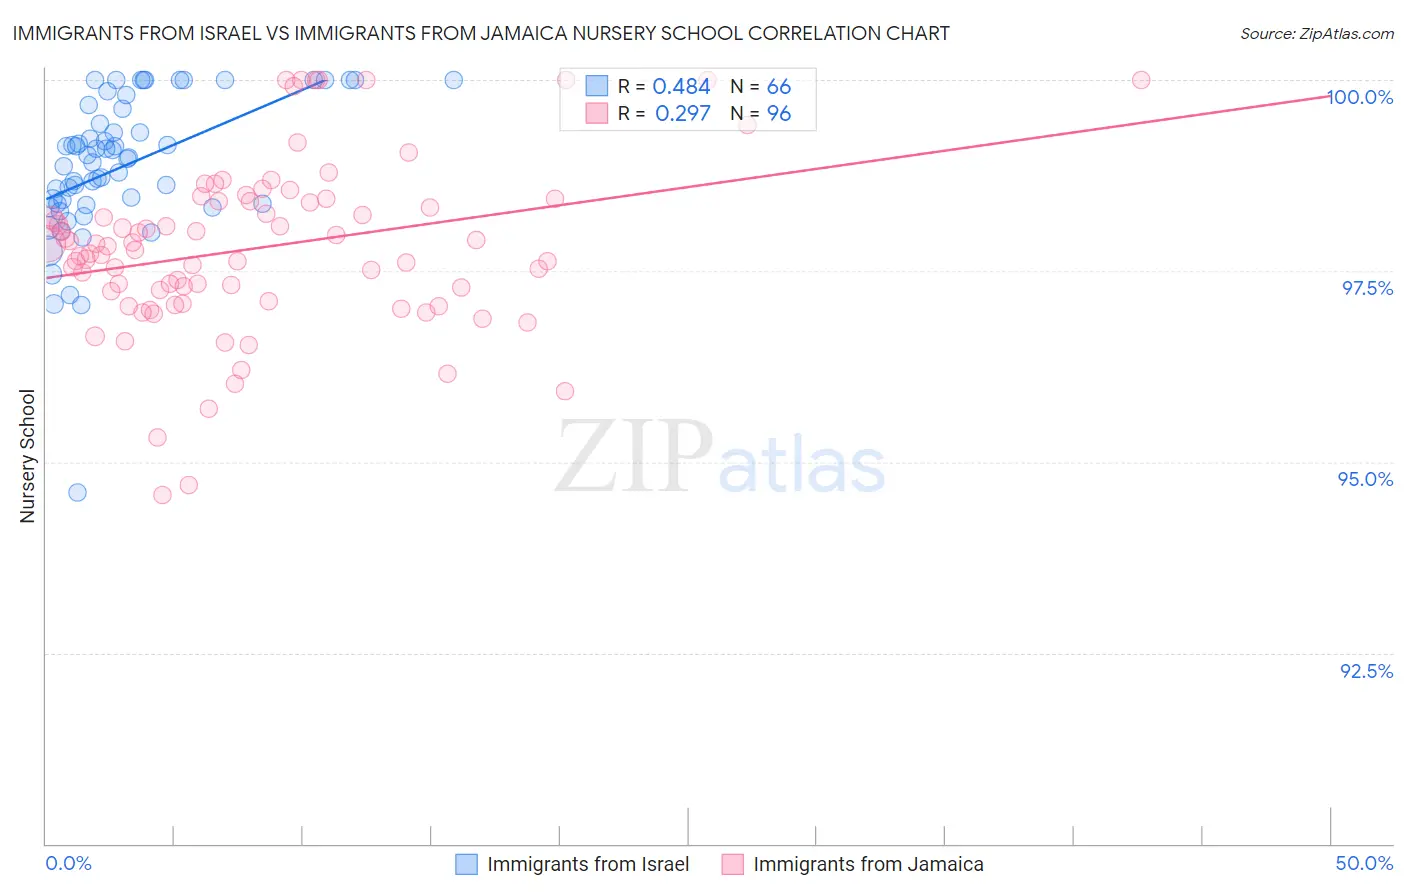
Immigrants from Israel vs Immigrants from Jamaica Nursery School Correlation Chart
The statistical analysis conducted on geographies consisting of 210,029,773 people shows a moderate positive correlation between the proportion of Immigrants from Israel and percentage of population with at least nursery school education in the United States with a correlation coefficient (R) of 0.484 and weighted average of 98.1%. Similarly, the statistical analysis conducted on geographies consisting of 301,830,081 people shows a weak positive correlation between the proportion of Immigrants from Jamaica and percentage of population with at least nursery school education in the United States with a correlation coefficient (R) of 0.297 and weighted average of 97.5%, a difference of 0.56%.
Nursery School Correlation Summary
| Measurement | Immigrants from Israel | Immigrants from Jamaica |
| Minimum | 94.6% | 94.6% |
| Maximum | 100.0% | 100.0% |
| Range | 5.4% | 5.4% |
| Mean | 98.9% | 97.8% |
| Median | 99.0% | 97.8% |
| Interquartile 25% (IQ1) | 98.4% | 97.2% |
| Interquartile 75% (IQ3) | 99.6% | 98.4% |
| Interquartile Range (IQR) | 1.2% | 1.3% |
| Standard Deviation (Sample) | 0.95% | 1.1% |
| Standard Deviation (Population) | 0.94% | 1.1% |
Similar Demographics by Nursery School
Demographics Similar to Immigrants from Israel by Nursery School
In terms of nursery school, the demographic groups most similar to Immigrants from Israel are Filipino (98.1%, a difference of 0.0%), Burmese (98.1%, a difference of 0.010%), Marshallese (98.1%, a difference of 0.010%), Alsatian (98.1%, a difference of 0.010%), and Hmong (98.1%, a difference of 0.010%).
| Demographics | Rating | Rank | Nursery School |
| Immigrants | Romania | 88.0 /100 | #138 | Excellent 98.1% |
| Blackfeet | 87.5 /100 | #139 | Excellent 98.1% |
| Palestinians | 83.7 /100 | #140 | Excellent 98.1% |
| Immigrants | Turkey | 83.0 /100 | #141 | Excellent 98.1% |
| Burmese | 81.7 /100 | #142 | Excellent 98.1% |
| Marshallese | 81.2 /100 | #143 | Excellent 98.1% |
| Alsatians | 80.3 /100 | #144 | Excellent 98.1% |
| Immigrants | Israel | 78.5 /100 | #145 | Good 98.1% |
| Filipinos | 78.5 /100 | #146 | Good 98.1% |
| Hmong | 75.7 /100 | #147 | Good 98.1% |
| Immigrants | Greece | 75.4 /100 | #148 | Good 98.1% |
| Apache | 73.2 /100 | #149 | Good 98.1% |
| Jordanians | 72.9 /100 | #150 | Good 98.1% |
| Soviet Union | 71.6 /100 | #151 | Good 98.0% |
| Dutch West Indians | 70.2 /100 | #152 | Good 98.0% |
Demographics Similar to Immigrants from Jamaica by Nursery School
In terms of nursery school, the demographic groups most similar to Immigrants from Jamaica are West Indian (97.5%, a difference of 0.010%), Immigrants from Liberia (97.5%, a difference of 0.010%), Immigrants from Nigeria (97.5%, a difference of 0.020%), Immigrants from Peru (97.5%, a difference of 0.020%), and Taiwanese (97.6%, a difference of 0.030%).
| Demographics | Rating | Rank | Nursery School |
| Fijians | 0.3 /100 | #263 | Tragic 97.6% |
| Taiwanese | 0.3 /100 | #264 | Tragic 97.6% |
| Assyrians/Chaldeans/Syriacs | 0.3 /100 | #265 | Tragic 97.6% |
| Immigrants | Sierra Leone | 0.3 /100 | #266 | Tragic 97.6% |
| Immigrants | Nigeria | 0.3 /100 | #267 | Tragic 97.5% |
| West Indians | 0.3 /100 | #268 | Tragic 97.5% |
| Immigrants | Liberia | 0.3 /100 | #269 | Tragic 97.5% |
| Immigrants | Jamaica | 0.2 /100 | #270 | Tragic 97.5% |
| Immigrants | Peru | 0.2 /100 | #271 | Tragic 97.5% |
| Immigrants | Bolivia | 0.1 /100 | #272 | Tragic 97.5% |
| Immigrants | China | 0.1 /100 | #273 | Tragic 97.5% |
| Immigrants | Cameroon | 0.1 /100 | #274 | Tragic 97.5% |
| Ghanaians | 0.1 /100 | #275 | Tragic 97.5% |
| Immigrants | Philippines | 0.1 /100 | #276 | Tragic 97.5% |
| Immigrants | Western Africa | 0.1 /100 | #277 | Tragic 97.4% |