Colombian vs Immigrants from Jamaica Nursery School
COMPARE
Colombian
Immigrants from Jamaica
Nursery School
Nursery School Comparison
Colombians
Immigrants from Jamaica
97.7%
NURSERY SCHOOL
2.1/ 100
METRIC RATING
234th/ 347
METRIC RANK
97.5%
NURSERY SCHOOL
0.2/ 100
METRIC RATING
270th/ 347
METRIC RANK
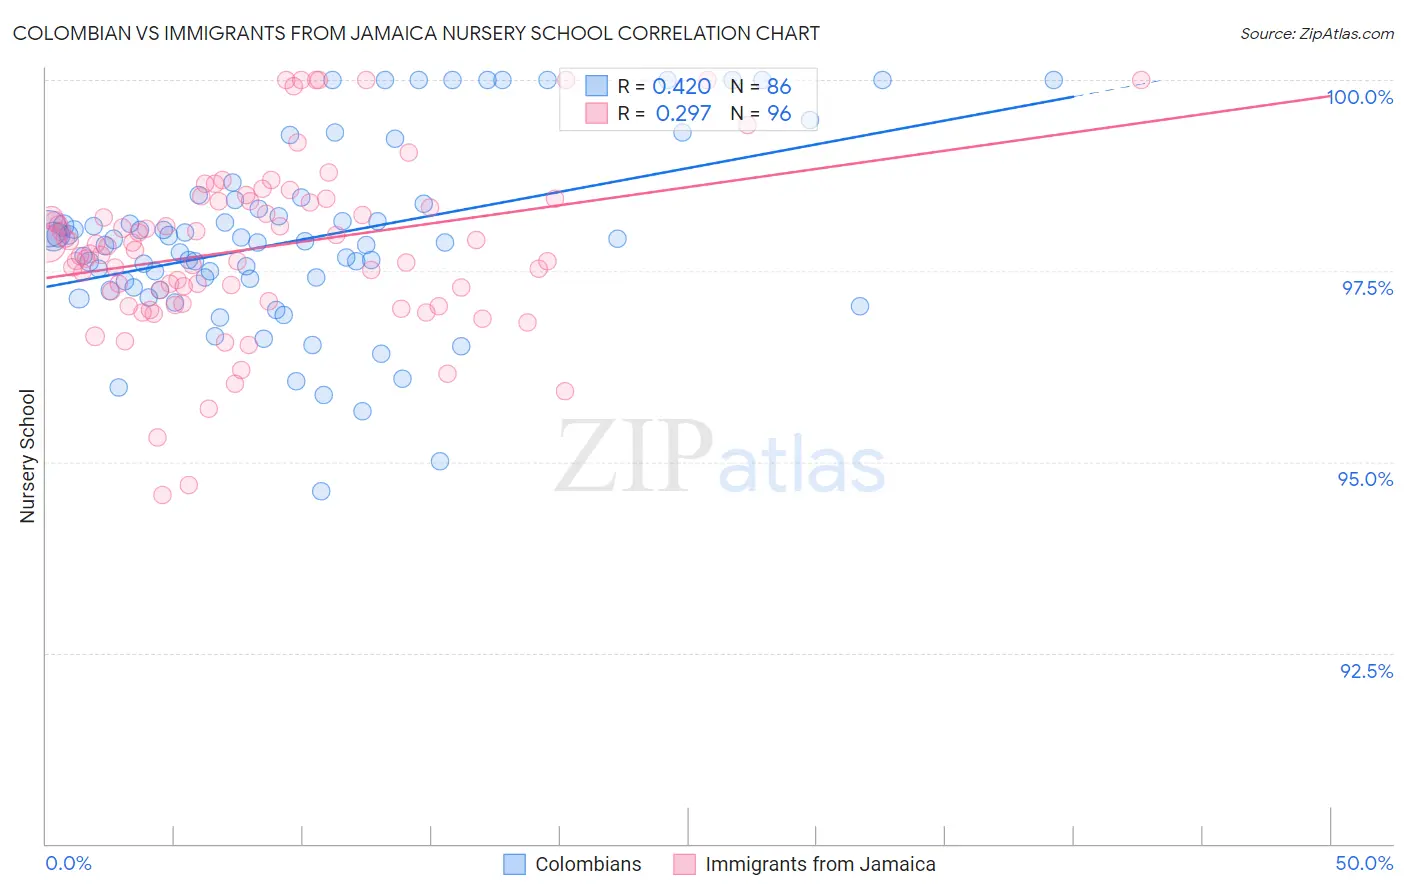
Colombian vs Immigrants from Jamaica Nursery School Correlation Chart
The statistical analysis conducted on geographies consisting of 419,700,680 people shows a moderate positive correlation between the proportion of Colombians and percentage of population with at least nursery school education in the United States with a correlation coefficient (R) of 0.420 and weighted average of 97.7%. Similarly, the statistical analysis conducted on geographies consisting of 301,830,081 people shows a weak positive correlation between the proportion of Immigrants from Jamaica and percentage of population with at least nursery school education in the United States with a correlation coefficient (R) of 0.297 and weighted average of 97.5%, a difference of 0.17%.
Nursery School Correlation Summary
| Measurement | Colombian | Immigrants from Jamaica |
| Minimum | 94.6% | 94.6% |
| Maximum | 100.0% | 100.0% |
| Range | 5.4% | 5.4% |
| Mean | 97.9% | 97.8% |
| Median | 97.9% | 97.8% |
| Interquartile 25% (IQ1) | 97.3% | 97.2% |
| Interquartile 75% (IQ3) | 98.4% | 98.4% |
| Interquartile Range (IQR) | 1.1% | 1.3% |
| Standard Deviation (Sample) | 1.2% | 1.1% |
| Standard Deviation (Population) | 1.2% | 1.1% |
Similar Demographics by Nursery School
Demographics Similar to Colombians by Nursery School
In terms of nursery school, the demographic groups most similar to Colombians are U.S. Virgin Islander (97.7%, a difference of 0.0%), Immigrants from Pakistan (97.7%, a difference of 0.0%), Immigrants from Uruguay (97.7%, a difference of 0.010%), Immigrants from Malaysia (97.7%, a difference of 0.010%), and Immigrants from Western Asia (97.7%, a difference of 0.010%).
| Demographics | Rating | Rank | Nursery School |
| Sub-Saharan Africans | 3.2 /100 | #227 | Tragic 97.7% |
| Sudanese | 3.2 /100 | #228 | Tragic 97.7% |
| Senegalese | 3.2 /100 | #229 | Tragic 97.7% |
| Sierra Leoneans | 2.9 /100 | #230 | Tragic 97.7% |
| Puerto Ricans | 2.6 /100 | #231 | Tragic 97.7% |
| Immigrants | Uruguay | 2.3 /100 | #232 | Tragic 97.7% |
| U.S. Virgin Islanders | 2.1 /100 | #233 | Tragic 97.7% |
| Colombians | 2.1 /100 | #234 | Tragic 97.7% |
| Immigrants | Pakistan | 2.1 /100 | #235 | Tragic 97.7% |
| Immigrants | Malaysia | 1.9 /100 | #236 | Tragic 97.7% |
| Immigrants | Western Asia | 1.9 /100 | #237 | Tragic 97.7% |
| Nigerians | 1.7 /100 | #238 | Tragic 97.7% |
| Immigrants | Eastern Asia | 1.6 /100 | #239 | Tragic 97.7% |
| Koreans | 1.4 /100 | #240 | Tragic 97.7% |
| Immigrants | Indonesia | 1.1 /100 | #241 | Tragic 97.7% |
Demographics Similar to Immigrants from Jamaica by Nursery School
In terms of nursery school, the demographic groups most similar to Immigrants from Jamaica are West Indian (97.5%, a difference of 0.010%), Immigrants from Liberia (97.5%, a difference of 0.010%), Immigrants from Nigeria (97.5%, a difference of 0.020%), Immigrants from Peru (97.5%, a difference of 0.020%), and Taiwanese (97.6%, a difference of 0.030%).
| Demographics | Rating | Rank | Nursery School |
| Fijians | 0.3 /100 | #263 | Tragic 97.6% |
| Taiwanese | 0.3 /100 | #264 | Tragic 97.6% |
| Assyrians/Chaldeans/Syriacs | 0.3 /100 | #265 | Tragic 97.6% |
| Immigrants | Sierra Leone | 0.3 /100 | #266 | Tragic 97.6% |
| Immigrants | Nigeria | 0.3 /100 | #267 | Tragic 97.5% |
| West Indians | 0.3 /100 | #268 | Tragic 97.5% |
| Immigrants | Liberia | 0.3 /100 | #269 | Tragic 97.5% |
| Immigrants | Jamaica | 0.2 /100 | #270 | Tragic 97.5% |
| Immigrants | Peru | 0.2 /100 | #271 | Tragic 97.5% |
| Immigrants | Bolivia | 0.1 /100 | #272 | Tragic 97.5% |
| Immigrants | China | 0.1 /100 | #273 | Tragic 97.5% |
| Immigrants | Cameroon | 0.1 /100 | #274 | Tragic 97.5% |
| Ghanaians | 0.1 /100 | #275 | Tragic 97.5% |
| Immigrants | Philippines | 0.1 /100 | #276 | Tragic 97.5% |
| Immigrants | Western Africa | 0.1 /100 | #277 | Tragic 97.4% |