Immigrants from Israel vs Guamanian/Chamorro Nursery School
COMPARE
Immigrants from Israel
Guamanian/Chamorro
Nursery School
Nursery School Comparison
Immigrants from Israel
Guamanians/Chamorros
98.1%
NURSERY SCHOOL
78.5/ 100
METRIC RATING
145th/ 347
METRIC RANK
97.9%
NURSERY SCHOOL
25.7/ 100
METRIC RATING
196th/ 347
METRIC RANK
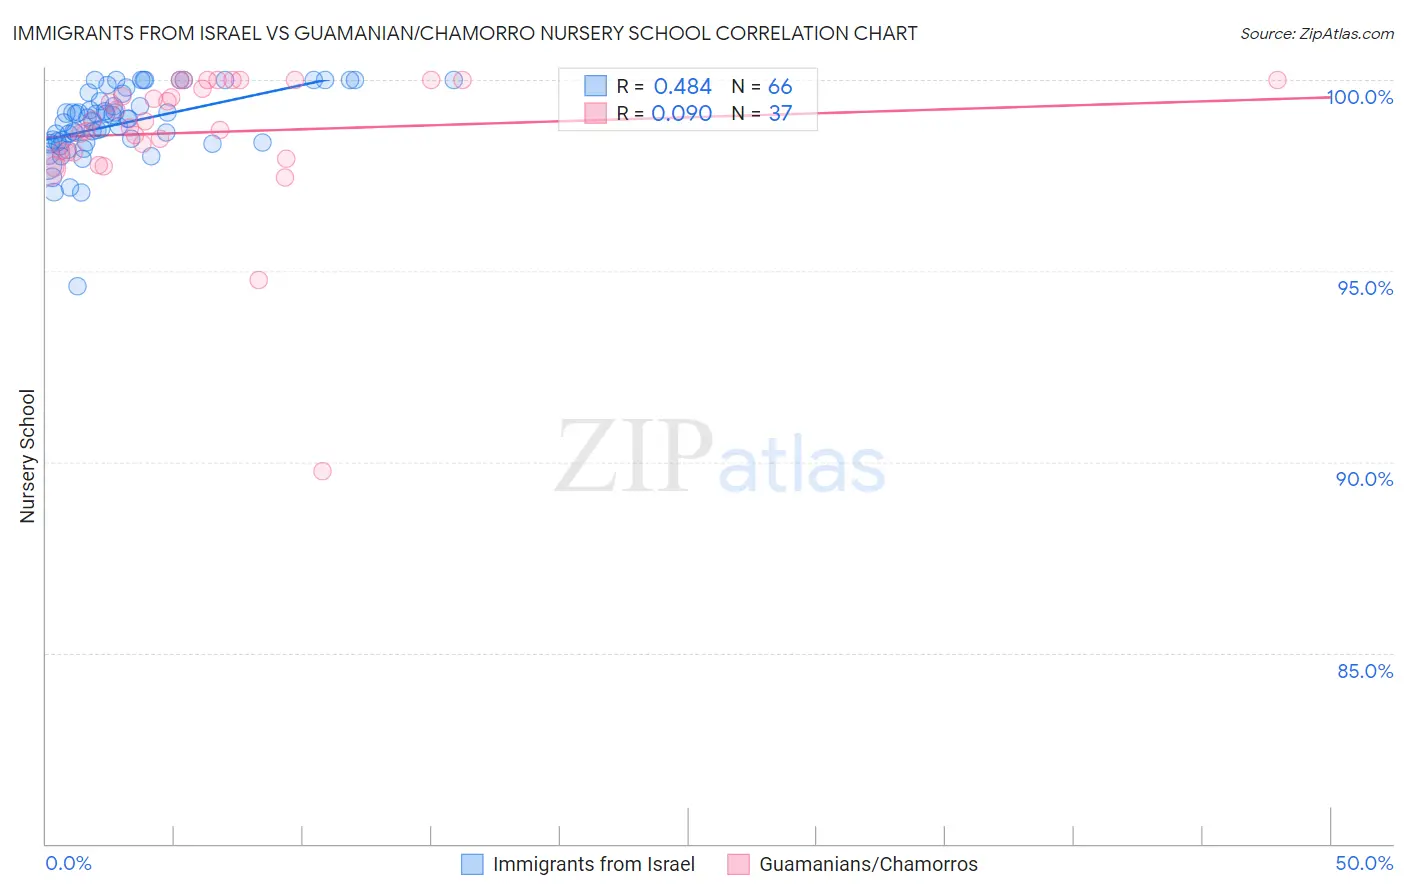
Immigrants from Israel vs Guamanian/Chamorro Nursery School Correlation Chart
The statistical analysis conducted on geographies consisting of 210,029,773 people shows a moderate positive correlation between the proportion of Immigrants from Israel and percentage of population with at least nursery school education in the United States with a correlation coefficient (R) of 0.484 and weighted average of 98.1%. Similarly, the statistical analysis conducted on geographies consisting of 221,965,618 people shows a slight positive correlation between the proportion of Guamanians/Chamorros and percentage of population with at least nursery school education in the United States with a correlation coefficient (R) of 0.090 and weighted average of 97.9%, a difference of 0.18%.
Nursery School Correlation Summary
| Measurement | Immigrants from Israel | Guamanian/Chamorro |
| Minimum | 94.6% | 89.7% |
| Maximum | 100.0% | 100.0% |
| Range | 5.4% | 10.3% |
| Mean | 98.9% | 98.6% |
| Median | 99.0% | 98.9% |
| Interquartile 25% (IQ1) | 98.4% | 98.1% |
| Interquartile 75% (IQ3) | 99.6% | 100.0% |
| Interquartile Range (IQR) | 1.2% | 1.9% |
| Standard Deviation (Sample) | 0.95% | 1.9% |
| Standard Deviation (Population) | 0.94% | 1.8% |
Similar Demographics by Nursery School
Demographics Similar to Immigrants from Israel by Nursery School
In terms of nursery school, the demographic groups most similar to Immigrants from Israel are Filipino (98.1%, a difference of 0.0%), Burmese (98.1%, a difference of 0.010%), Marshallese (98.1%, a difference of 0.010%), Alsatian (98.1%, a difference of 0.010%), and Hmong (98.1%, a difference of 0.010%).
| Demographics | Rating | Rank | Nursery School |
| Immigrants | Romania | 88.0 /100 | #138 | Excellent 98.1% |
| Blackfeet | 87.5 /100 | #139 | Excellent 98.1% |
| Palestinians | 83.7 /100 | #140 | Excellent 98.1% |
| Immigrants | Turkey | 83.0 /100 | #141 | Excellent 98.1% |
| Burmese | 81.7 /100 | #142 | Excellent 98.1% |
| Marshallese | 81.2 /100 | #143 | Excellent 98.1% |
| Alsatians | 80.3 /100 | #144 | Excellent 98.1% |
| Immigrants | Israel | 78.5 /100 | #145 | Good 98.1% |
| Filipinos | 78.5 /100 | #146 | Good 98.1% |
| Hmong | 75.7 /100 | #147 | Good 98.1% |
| Immigrants | Greece | 75.4 /100 | #148 | Good 98.1% |
| Apache | 73.2 /100 | #149 | Good 98.1% |
| Jordanians | 72.9 /100 | #150 | Good 98.1% |
| Soviet Union | 71.6 /100 | #151 | Good 98.0% |
| Dutch West Indians | 70.2 /100 | #152 | Good 98.0% |
Demographics Similar to Guamanians/Chamorros by Nursery School
In terms of nursery school, the demographic groups most similar to Guamanians/Chamorros are Yuman (97.9%, a difference of 0.0%), Black/African American (97.9%, a difference of 0.010%), Paraguayan (97.9%, a difference of 0.010%), Mongolian (97.9%, a difference of 0.010%), and Hawaiian (97.9%, a difference of 0.010%).
| Demographics | Rating | Rank | Nursery School |
| Pakistanis | 34.6 /100 | #189 | Fair 97.9% |
| Panamanians | 34.3 /100 | #190 | Fair 97.9% |
| Immigrants | Taiwan | 30.6 /100 | #191 | Fair 97.9% |
| Blacks/African Americans | 29.4 /100 | #192 | Fair 97.9% |
| Paraguayans | 27.4 /100 | #193 | Fair 97.9% |
| Mongolians | 27.3 /100 | #194 | Fair 97.9% |
| Hawaiians | 27.2 /100 | #195 | Fair 97.9% |
| Guamanians/Chamorros | 25.7 /100 | #196 | Fair 97.9% |
| Yuman | 25.7 /100 | #197 | Fair 97.9% |
| Immigrants | Kenya | 24.1 /100 | #198 | Fair 97.9% |
| Immigrants | Egypt | 22.5 /100 | #199 | Fair 97.9% |
| Tohono O'odham | 22.2 /100 | #200 | Fair 97.9% |
| Immigrants | Lebanon | 21.2 /100 | #201 | Fair 97.9% |
| Immigrants | Ukraine | 19.9 /100 | #202 | Poor 97.9% |
| Immigrants | Uganda | 18.0 /100 | #203 | Poor 97.9% |