Immigrants from Ireland vs Nigerian Single Mother Households

COMPARE

Immigrants from Ireland
Race
Ancestry
AfghanAfricanAlaska NativeAlaskan AthabascanAlbanianAleutAlsatianAmericanApacheArabArapahoArgentineanArmenianAssyrian/Chaldean/SyriacAustralianAustrianBahamianBangladeshiBarbadianBasqueBelgianBelizeanBermudanBhutaneseBlackfeetBolivianBrazilianBritishBritish West IndianBulgarianBurmeseCajunCambodianCanadianCape VerdeanCarpatho RusynCelticCentral AmericanCentral American IndianCherokeeCheyenneChickasawChileanChineseChippewaChoctawColombianColvilleComancheCosta RicanCreeCreekCroatianCrowCubanCypriotCzechCzechoslovakianDanishDelawareDominicanDutchDutch West IndianEastern EuropeanEcuadorianEgyptianEnglishEstonianEthiopianEuropeanFijianFilipinoFinnishFrenchFrench American IndianFrench CanadianGermanGerman RussianGhanaianGreekGuamanian/ChamorroGuatemalanGuyaneseHaitianHmongHonduranHopiHoumaHungarianIcelanderIndian (Asian)IndonesianInupiatIranianIraqiIrishIroquoisIsraeliItalianJamaicanJapaneseJordanianKenyanKiowaKoreanLaotianLatvianLebaneseLiberianLithuanianLumbeeLuxembourgerMacedonianMalaysianMalteseMarshalleseMenomineeMexicanMexican American IndianMongolianMoroccanNative HawaiianNavajoNepaleseNew ZealanderNicaraguanNorthern EuropeanNorwegianOkinawanOsageOttawaPaiutePakistaniPalestinianPanamanianParaguayanPennsylvania GermanPeruvianPimaPolishPortuguesePotawatomiPuebloPuerto RicanPuget Sound SalishRomanianRussianSalvadoranSamoanScandinavianScotch-IrishScottishSeminoleSenegaleseSerbianShoshoneSierra LeoneanSiouxSlavicSlovakSloveneSomaliSouth AfricanSouth AmericanSouth American IndianSoviet UnionSpaniardSpanishSpanish AmericanSpanish American IndianSri LankanSubsaharan AfricanSudaneseSwedishSwissSyrianTaiwaneseThaiTlingit-HaidaTohono O'OdhamTonganTrinidadian and TobagonianTsimshianTurkishU.S. Virgin IslanderUgandanUkrainianUruguayanUteVenezuelanVietnameseWelshWest IndianYakamaYaquiYugoslavianYumanYup'ikZimbabwean
Immigration
NonimmigrantsImmigrantsAfghanistanAfricaAlbaniaArgentinaArmeniaAsiaAustraliaAustriaBahamasBangladeshBarbadosBelarusBelgiumBelizeBoliviaBosnia and HerzegovinaBrazilBulgariaBurma/MyanmarCabo VerdeCambodiaCameroonCanadaCaribbeanCentral AmericaChileChinaColombiaCongoCosta RicaCroatiaCubaCzechoslovakiaDenmarkDominicaDominican RepublicEastern AfricaEastern AsiaEastern EuropeEcuadorEgyptEl SalvadorEnglandEritreaEthiopiaEuropeFijiFranceGermanyGhanaGreeceGrenadaGuatemalaGuyanaHaitiHondurasHong KongHungaryIndiaIndonesiaIranIraqIrelandIsraelItalyJamaicaJapanJordanKazakhstanKenyaKoreaKuwaitLaosLatin AmericaLatviaLebanonLiberiaLithuaniaMalaysiaMexicoMicronesiaMiddle AfricaMoldovaMoroccoNepalNetherlandsNicaraguaNigeriaNorth AmericaNorth MacedoniaNorthern AfricaNorthern EuropeNorwayOceaniaPakistanPanamaPeruPhilippinesPolandPortugalRomaniaRussiaSaudi ArabiaScotlandSenegalSerbiaSierra LeoneSingaporeSomaliaSouth AfricaSouth AmericaSouth Central AsiaSouth Eastern AsiaSouthern EuropeSpainSri LankaSt. Vincent and the GrenadinesSudanSwedenSwitzerlandSyriaTaiwanThailandTrinidad and TobagoTurkeyUgandaUkraineUruguayUzbekistanVenezuelaVietnamWest IndiesWestern AfricaWestern AsiaWestern EuropeYemenZaireZimbabweAzores
Nigerian
Race
Ancestry
AfghanAfricanAlaska NativeAlaskan AthabascanAlbanianAleutAlsatianAmericanApacheArabArapahoArgentineanArmenianAssyrian/Chaldean/SyriacAustralianAustrianBahamianBangladeshiBarbadianBasqueBelgianBelizeanBermudanBhutaneseBlackfeetBolivianBrazilianBritishBritish West IndianBulgarianBurmeseCajunCambodianCanadianCape VerdeanCarpatho RusynCelticCentral AmericanCentral American IndianCherokeeCheyenneChickasawChileanChineseChippewaChoctawColombianColvilleComancheCosta RicanCreeCreekCroatianCrowCubanCypriotCzechCzechoslovakianDanishDelawareDominicanDutchDutch West IndianEastern EuropeanEcuadorianEgyptianEnglishEstonianEthiopianEuropeanFijianFilipinoFinnishFrenchFrench American IndianFrench CanadianGermanGerman RussianGhanaianGreekGuamanian/ChamorroGuatemalanGuyaneseHaitianHmongHonduranHopiHoumaHungarianIcelanderIndian (Asian)IndonesianInupiatIranianIraqiIrishIroquoisIsraeliItalianJamaicanJapaneseJordanianKenyanKiowaKoreanLaotianLatvianLebaneseLiberianLithuanianLumbeeLuxembourgerMacedonianMalaysianMalteseMarshalleseMenomineeMexicanMexican American IndianMongolianMoroccanNative HawaiianNavajoNepaleseNew ZealanderNicaraguanNigerianNorthern EuropeanNorwegianOkinawanOsageOttawaPaiutePakistaniPalestinianPanamanianParaguayanPennsylvania GermanPeruvianPimaPolishPortuguesePotawatomiPuebloPuerto RicanPuget Sound SalishRomanianRussianSalvadoranSamoanScandinavianScotch-IrishScottishSeminoleSenegaleseSerbianShoshoneSierra LeoneanSiouxSlavicSlovakSloveneSomaliSouth AfricanSouth AmericanSouth American IndianSoviet UnionSpaniardSpanishSpanish AmericanSpanish American IndianSri LankanSubsaharan AfricanSudaneseSwedishSwissSyrianTaiwaneseThaiTlingit-HaidaTohono O'OdhamTonganTrinidadian and TobagonianTsimshianTurkishU.S. Virgin IslanderUgandanUkrainianUruguayanUteVenezuelanVietnameseWelshWest IndianYakamaYaquiYugoslavianYumanYup'ikZimbabwean
Immigration
NonimmigrantsImmigrantsAfghanistanAfricaAlbaniaArgentinaArmeniaAsiaAustraliaAustriaBahamasBangladeshBarbadosBelarusBelgiumBelizeBoliviaBosnia and HerzegovinaBrazilBulgariaBurma/MyanmarCabo VerdeCambodiaCameroonCanadaCaribbeanCentral AmericaChileChinaColombiaCongoCosta RicaCroatiaCubaCzechoslovakiaDenmarkDominicaDominican RepublicEastern AfricaEastern AsiaEastern EuropeEcuadorEgyptEl SalvadorEnglandEritreaEthiopiaEuropeFijiFranceGermanyGhanaGreeceGrenadaGuatemalaGuyanaHaitiHondurasHong KongHungaryIndiaIndonesiaIranIraqIsraelItalyJamaicaJapanJordanKazakhstanKenyaKoreaKuwaitLaosLatin AmericaLatviaLebanonLiberiaLithuaniaMalaysiaMexicoMicronesiaMiddle AfricaMoldovaMoroccoNepalNetherlandsNicaraguaNigeriaNorth AmericaNorth MacedoniaNorthern AfricaNorthern EuropeNorwayOceaniaPakistanPanamaPeruPhilippinesPolandPortugalRomaniaRussiaSaudi ArabiaScotlandSenegalSerbiaSierra LeoneSingaporeSomaliaSouth AfricaSouth AmericaSouth Central AsiaSouth Eastern AsiaSouthern EuropeSpainSri LankaSt. Vincent and the GrenadinesSudanSwedenSwitzerlandSyriaTaiwanThailandTrinidad and TobagoTurkeyUgandaUkraineUruguayUzbekistanVenezuelaVietnamWest IndiesWestern AfricaWestern AsiaWestern EuropeYemenZaireZimbabweAzores
Single Mother Households
Income
Poverty
Unemployment
Labor Participation
Family Structure
Vehicle Availability
Education Level
Disability

Single Mother Households Comparison

Immigrants from Ireland

Nigerians

Exceptional
Tragic
5.0%
SINGLE MOTHER HOUSEHOLDS
99.9/ 100
METRIC RATING
8th/ 347
METRIC RANK
7.7%
SINGLE MOTHER HOUSEHOLDS
0.0/ 100
METRIC RATING
283rd/ 347
METRIC RANK

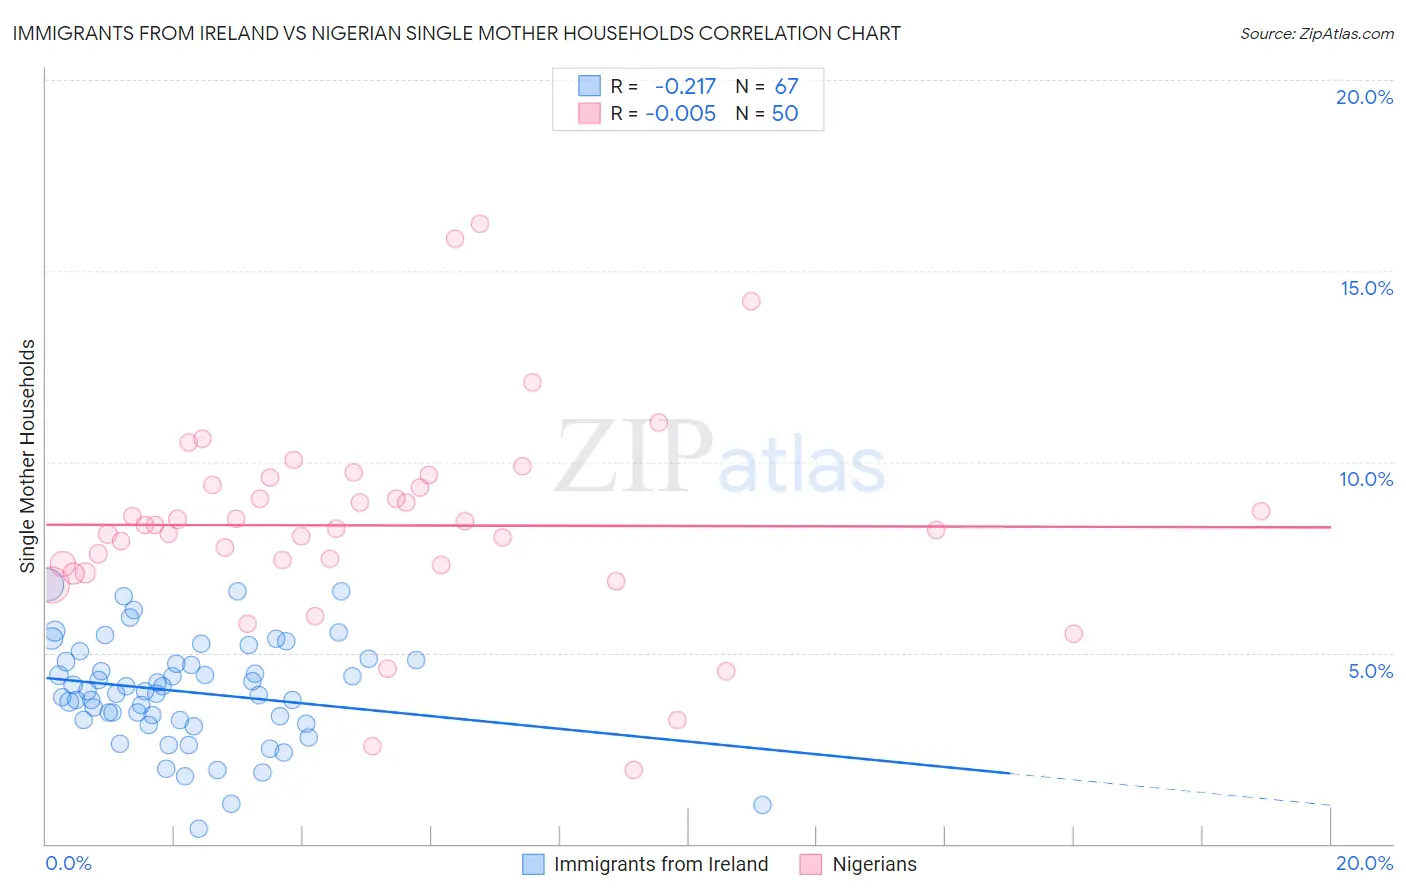
Immigrants from Ireland vs Nigerian Single Mother Households Correlation Chart

The statistical analysis conducted on geographies consisting of 240,180,229 people shows a weak negative correlation between the proportion of Immigrants from Ireland and percentage of single mother households in the United States with a correlation coefficient (R) of -0.217 and weighted average of 5.0%. Similarly, the statistical analysis conducted on geographies consisting of 332,046,179 people shows no correlation between the proportion of Nigerians and percentage of single mother households in the United States with a correlation coefficient (R) of -0.005 and weighted average of 7.7%, a difference of 53.2%.
Immigrants from Ireland vs Nigerian Single Mother Households

Single Mother Households Correlation Summary

MeasurementImmigrants from IrelandNigerian
Minimum0.40%1.9%
Maximum6.8%16.2%
Range6.4%14.3%
Mean4.0%8.3%
Median4.0%8.3%
Interquartile 25% (IQ1)3.2%7.3%
Interquartile 75% (IQ3)4.8%9.4%
Interquartile Range (IQR)1.6%2.1%
Standard Deviation (Sample)1.4%2.7%
Standard Deviation (Population)1.4%2.7%

Similar Demographics by Single Mother Households

Demographics Similar to Immigrants from Ireland by Single Mother Households

In terms of single mother households, the demographic groups most similar to Immigrants from Ireland are Okinawan (5.0%, a difference of 0.15%), Immigrants from Israel (5.0%, a difference of 0.49%), Iranian (5.0%, a difference of 0.66%), Immigrants from Singapore (5.0%, a difference of 0.91%), and Immigrants from China (5.1%, a difference of 1.1%).
DemographicsRating | RankSingle Mother Households
Immigrants | Taiwan
100.0
/100
|
#1
Exceptional
4.7%
Filipinos
100.0
/100
|
#2
Exceptional
4.7%
Immigrants | Iran
100.0
/100
|
#3
Exceptional
4.8%
Assyrians/Chaldeans/Syriacs
100.0
/100
|
#4
Exceptional
4.8%
Immigrants | Hong Kong
100.0
/100
|
#5
Exceptional
4.8%
Immigrants | Singapore
100.0
/100
|
#6
Exceptional
5.0%
Iranians
100.0
/100
|
#7
Exceptional
5.0%
Immigrants | Ireland
99.9
/100
|
#8
Exceptional
5.0%
Okinawans
99.9
/100
|
#9
Exceptional
5.0%
Immigrants | Israel
99.9
/100
|
#10
Exceptional
5.0%
Immigrants | China
99.9
/100
|
#11
Exceptional
5.1%
Cypriots
99.9
/100
|
#12
Exceptional
5.1%
Immigrants | India
99.9
/100
|
#13
Exceptional
5.1%
Immigrants | Australia
99.9
/100
|
#14
Exceptional
5.1%
Immigrants | Eastern Asia
99.9
/100
|
#15
Exceptional
5.1%

Demographics Similar to Nigerians by Single Mother Households

In terms of single mother households, the demographic groups most similar to Nigerians are Guatemalan (7.7%, a difference of 0.030%), Immigrants from Sierra Leone (7.7%, a difference of 0.050%), Immigrants from Laos (7.7%, a difference of 0.050%), Immigrants from El Salvador (7.6%, a difference of 0.57%), and Immigrants from Belize (7.7%, a difference of 0.60%).
DemographicsRating | RankSingle Mother Households
Guyanese
0.1
/100
|
#276
Tragic
7.6%
Immigrants | Trinidad and Tobago
0.1
/100
|
#277
Tragic
7.6%
Central Americans
0.1
/100
|
#278
Tragic
7.6%
Immigrants | El Salvador
0.0
/100
|
#279
Tragic
7.6%
Immigrants | Sierra Leone
0.0
/100
|
#280
Tragic
7.7%
Immigrants | Laos
0.0
/100
|
#281
Tragic
7.7%
Guatemalans
0.0
/100
|
#282
Tragic
7.7%
Nigerians
0.0
/100
|
#283
Tragic
7.7%
Immigrants | Belize
0.0
/100
|
#284
Tragic
7.7%
Trinidadians and Tobagonians
0.0
/100
|
#285
Tragic
7.7%
Immigrants | Middle Africa
0.0
/100
|
#286
Tragic
7.7%
Immigrants | Guatemala
0.0
/100
|
#287
Tragic
7.7%
Sierra Leoneans
0.0
/100
|
#288
Tragic
7.7%
Sub-Saharan Africans
0.0
/100
|
#289
Tragic
7.8%
Immigrants | Nigeria
0.0
/100
|
#290
Tragic
7.8%