Immigrants from Cameroon vs Lebanese 5th Grade
COMPARE
Immigrants from Cameroon
Lebanese
5th Grade
5th Grade Comparison
Immigrants from Cameroon
Lebanese
96.7%
5TH GRADE
0.1/ 100
METRIC RATING
274th/ 347
METRIC RANK
97.6%
5TH GRADE
95.7/ 100
METRIC RATING
114th/ 347
METRIC RANK
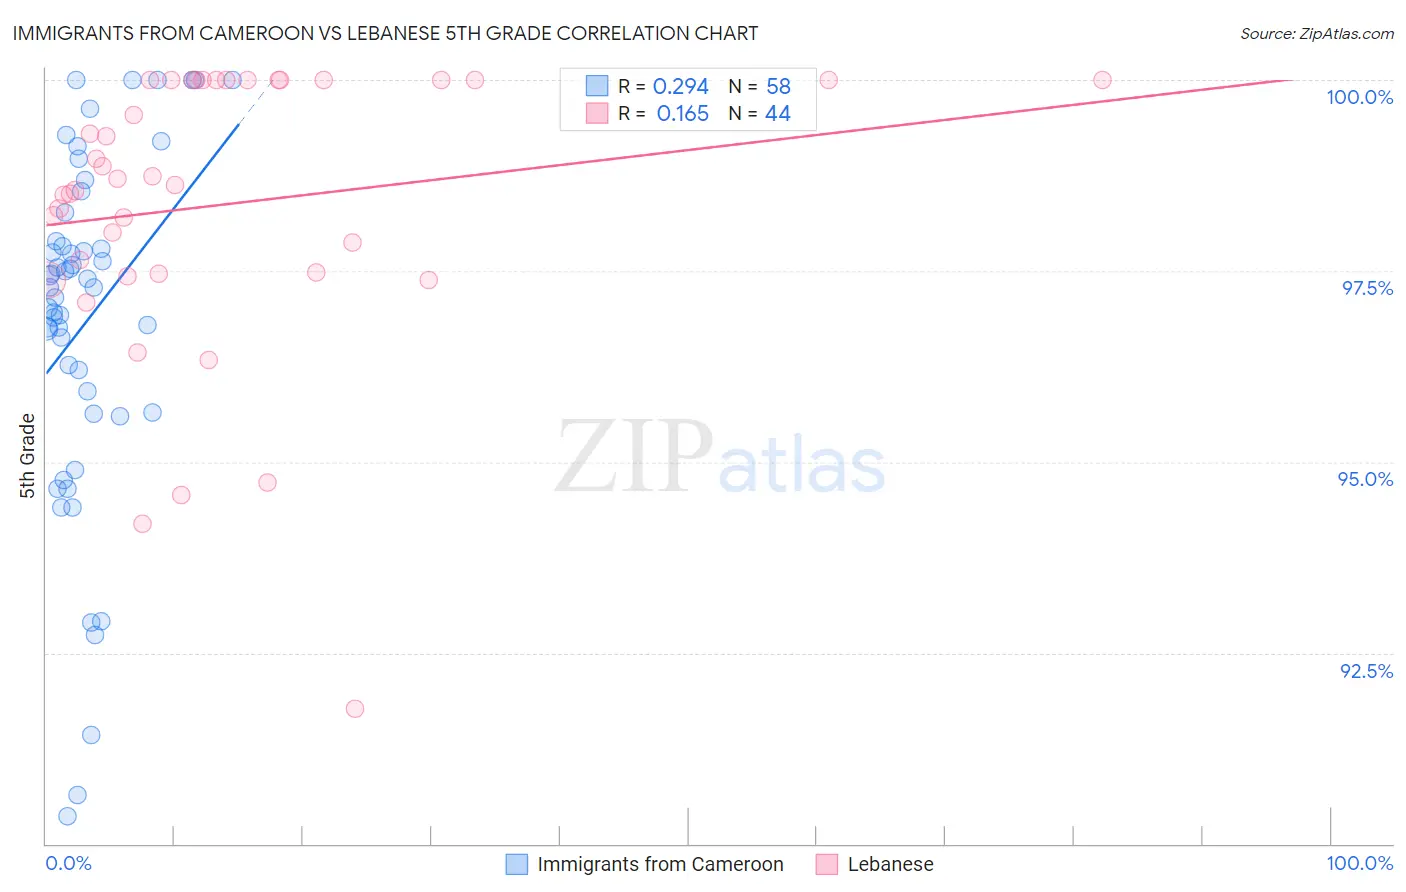
Immigrants from Cameroon vs Lebanese 5th Grade Correlation Chart
The statistical analysis conducted on geographies consisting of 130,752,798 people shows a weak positive correlation between the proportion of Immigrants from Cameroon and percentage of population with at least 5th grade education in the United States with a correlation coefficient (R) of 0.294 and weighted average of 96.7%. Similarly, the statistical analysis conducted on geographies consisting of 401,624,157 people shows a poor positive correlation between the proportion of Lebanese and percentage of population with at least 5th grade education in the United States with a correlation coefficient (R) of 0.165 and weighted average of 97.6%, a difference of 1.0%.
5th Grade Correlation Summary
| Measurement | Immigrants from Cameroon | Lebanese |
| Minimum | 90.4% | 91.8% |
| Maximum | 100.0% | 100.0% |
| Range | 9.6% | 8.2% |
| Mean | 96.8% | 98.4% |
| Median | 97.3% | 98.7% |
| Interquartile 25% (IQ1) | 95.7% | 97.5% |
| Interquartile 75% (IQ3) | 97.9% | 100.0% |
| Interquartile Range (IQR) | 2.2% | 2.5% |
| Standard Deviation (Sample) | 2.3% | 1.9% |
| Standard Deviation (Population) | 2.3% | 1.8% |
Similar Demographics by 5th Grade
Demographics Similar to Immigrants from Cameroon by 5th Grade
In terms of 5th grade, the demographic groups most similar to Immigrants from Cameroon are Yaqui (96.7%, a difference of 0.0%), Trinidadian and Tobagonian (96.7%, a difference of 0.010%), Immigrants from Peru (96.6%, a difference of 0.010%), Cuban (96.6%, a difference of 0.010%), and Immigrants from Bolivia (96.6%, a difference of 0.010%).
| Demographics | Rating | Rank | 5th Grade |
| Immigrants | South America | 0.3 /100 | #267 | Tragic 96.7% |
| Armenians | 0.3 /100 | #268 | Tragic 96.7% |
| Ghanaians | 0.2 /100 | #269 | Tragic 96.7% |
| Afghans | 0.2 /100 | #270 | Tragic 96.7% |
| Immigrants | Hong Kong | 0.2 /100 | #271 | Tragic 96.7% |
| Trinidadians and Tobagonians | 0.1 /100 | #272 | Tragic 96.7% |
| Yaqui | 0.1 /100 | #273 | Tragic 96.7% |
| Immigrants | Cameroon | 0.1 /100 | #274 | Tragic 96.7% |
| Immigrants | Peru | 0.1 /100 | #275 | Tragic 96.6% |
| Cubans | 0.1 /100 | #276 | Tragic 96.6% |
| Immigrants | Bolivia | 0.1 /100 | #277 | Tragic 96.6% |
| Immigrants | Ghana | 0.1 /100 | #278 | Tragic 96.6% |
| Immigrants | Philippines | 0.1 /100 | #279 | Tragic 96.6% |
| Immigrants | Western Africa | 0.1 /100 | #280 | Tragic 96.6% |
| Houma | 0.1 /100 | #281 | Tragic 96.6% |
Demographics Similar to Lebanese by 5th Grade
In terms of 5th grade, the demographic groups most similar to Lebanese are Okinawan (97.6%, a difference of 0.0%), Immigrants from Croatia (97.6%, a difference of 0.0%), Immigrants from Switzerland (97.7%, a difference of 0.010%), Iroquois (97.7%, a difference of 0.010%), and Immigrants from Saudi Arabia (97.6%, a difference of 0.010%).
| Demographics | Rating | Rank | 5th Grade |
| Immigrants | Singapore | 97.5 /100 | #107 | Exceptional 97.7% |
| Immigrants | Nonimmigrants | 97.3 /100 | #108 | Exceptional 97.7% |
| Immigrants | Latvia | 97.1 /100 | #109 | Exceptional 97.7% |
| Thais | 96.9 /100 | #110 | Exceptional 97.7% |
| Menominee | 96.3 /100 | #111 | Exceptional 97.7% |
| Immigrants | Switzerland | 96.0 /100 | #112 | Exceptional 97.7% |
| Iroquois | 95.9 /100 | #113 | Exceptional 97.7% |
| Lebanese | 95.7 /100 | #114 | Exceptional 97.6% |
| Okinawans | 95.7 /100 | #115 | Exceptional 97.6% |
| Immigrants | Croatia | 95.5 /100 | #116 | Exceptional 97.6% |
| Immigrants | Saudi Arabia | 95.4 /100 | #117 | Exceptional 97.6% |
| Basques | 95.2 /100 | #118 | Exceptional 97.6% |
| Syrians | 95.1 /100 | #119 | Exceptional 97.6% |
| Immigrants | Zimbabwe | 94.9 /100 | #120 | Exceptional 97.6% |
| Immigrants | France | 94.8 /100 | #121 | Exceptional 97.6% |