Immigrants from Ireland vs Immigrants from Yemen 5th Grade
COMPARE
Immigrants from Ireland
Immigrants from Yemen
5th Grade
5th Grade Comparison
Immigrants from Ireland
Immigrants from Yemen
97.8%
5TH GRADE
98.8/ 100
METRIC RATING
90th/ 347
METRIC RANK
94.9%
5TH GRADE
0.0/ 100
METRIC RATING
339th/ 347
METRIC RANK
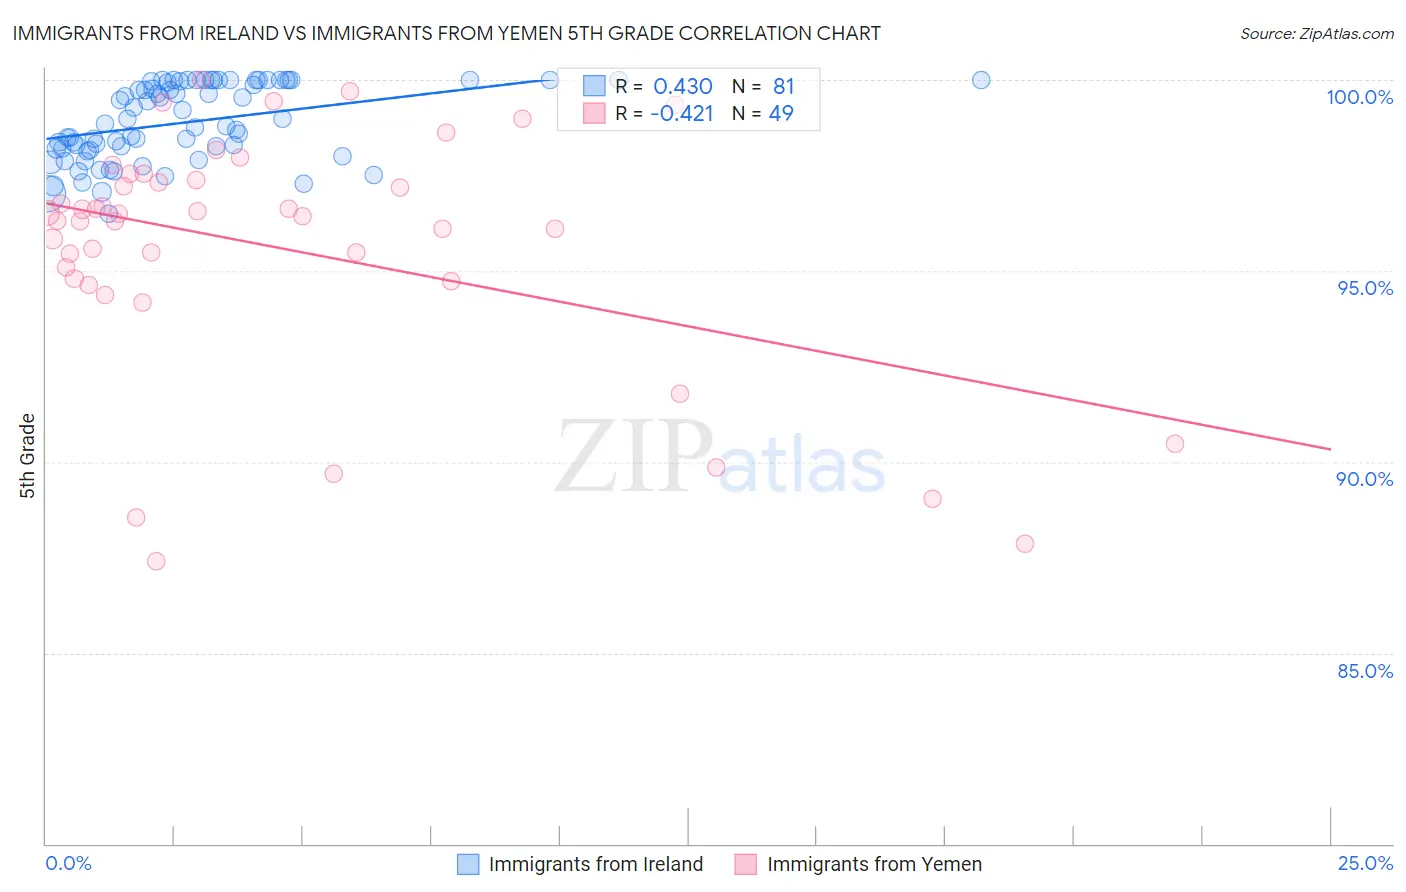
Immigrants from Ireland vs Immigrants from Yemen 5th Grade Correlation Chart
The statistical analysis conducted on geographies consisting of 240,784,498 people shows a moderate positive correlation between the proportion of Immigrants from Ireland and percentage of population with at least 5th grade education in the United States with a correlation coefficient (R) of 0.430 and weighted average of 97.8%. Similarly, the statistical analysis conducted on geographies consisting of 82,429,885 people shows a moderate negative correlation between the proportion of Immigrants from Yemen and percentage of population with at least 5th grade education in the United States with a correlation coefficient (R) of -0.421 and weighted average of 94.9%, a difference of 3.1%.
5th Grade Correlation Summary
| Measurement | Immigrants from Ireland | Immigrants from Yemen |
| Minimum | 96.5% | 87.4% |
| Maximum | 100.0% | 100.0% |
| Range | 3.5% | 12.6% |
| Mean | 98.9% | 95.6% |
| Median | 98.8% | 96.4% |
| Interquartile 25% (IQ1) | 98.2% | 94.8% |
| Interquartile 75% (IQ3) | 100.0% | 97.5% |
| Interquartile Range (IQR) | 1.8% | 2.7% |
| Standard Deviation (Sample) | 0.99% | 3.2% |
| Standard Deviation (Population) | 0.98% | 3.1% |
Similar Demographics by 5th Grade
Demographics Similar to Immigrants from Ireland by 5th Grade
In terms of 5th grade, the demographic groups most similar to Immigrants from Ireland are Immigrants from Australia (97.8%, a difference of 0.0%), Shoshone (97.8%, a difference of 0.0%), Immigrants from South Africa (97.8%, a difference of 0.0%), Immigrants from Western Europe (97.8%, a difference of 0.0%), and Cypriot (97.8%, a difference of 0.010%).
| Demographics | Rating | Rank | 5th Grade |
| Zimbabweans | 99.0 /100 | #83 | Exceptional 97.8% |
| Potawatomi | 99.0 /100 | #84 | Exceptional 97.8% |
| Immigrants | Belgium | 99.0 /100 | #85 | Exceptional 97.8% |
| Cypriots | 98.9 /100 | #86 | Exceptional 97.8% |
| Immigrants | Australia | 98.8 /100 | #87 | Exceptional 97.8% |
| Shoshone | 98.8 /100 | #88 | Exceptional 97.8% |
| Immigrants | South Africa | 98.8 /100 | #89 | Exceptional 97.8% |
| Immigrants | Ireland | 98.8 /100 | #90 | Exceptional 97.8% |
| Immigrants | Western Europe | 98.8 /100 | #91 | Exceptional 97.8% |
| Immigrants | Sweden | 98.7 /100 | #92 | Exceptional 97.8% |
| Delaware | 98.6 /100 | #93 | Exceptional 97.8% |
| Immigrants | Denmark | 98.6 /100 | #94 | Exceptional 97.8% |
| Romanians | 98.6 /100 | #95 | Exceptional 97.8% |
| Immigrants | Germany | 98.5 /100 | #96 | Exceptional 97.8% |
| Cree | 98.4 /100 | #97 | Exceptional 97.7% |
Demographics Similar to Immigrants from Yemen by 5th Grade
In terms of 5th grade, the demographic groups most similar to Immigrants from Yemen are Guatemalan (94.8%, a difference of 0.030%), Immigrants from Cabo Verde (94.9%, a difference of 0.050%), Yakama (94.8%, a difference of 0.10%), Central American (95.1%, a difference of 0.21%), and Immigrants from Central America (94.7%, a difference of 0.21%).
| Demographics | Rating | Rank | 5th Grade |
| Immigrants | Dominican Republic | 0.0 /100 | #332 | Tragic 95.3% |
| Immigrants | Latin America | 0.0 /100 | #333 | Tragic 95.3% |
| Nepalese | 0.0 /100 | #334 | Tragic 95.2% |
| Mexicans | 0.0 /100 | #335 | Tragic 95.2% |
| Immigrants | Azores | 0.0 /100 | #336 | Tragic 95.1% |
| Central Americans | 0.0 /100 | #337 | Tragic 95.1% |
| Immigrants | Cabo Verde | 0.0 /100 | #338 | Tragic 94.9% |
| Immigrants | Yemen | 0.0 /100 | #339 | Tragic 94.9% |
| Guatemalans | 0.0 /100 | #340 | Tragic 94.8% |
| Yakama | 0.0 /100 | #341 | Tragic 94.8% |
| Immigrants | Central America | 0.0 /100 | #342 | Tragic 94.7% |
| Salvadorans | 0.0 /100 | #343 | Tragic 94.6% |
| Immigrants | Mexico | 0.0 /100 | #344 | Tragic 94.6% |
| Immigrants | Guatemala | 0.0 /100 | #345 | Tragic 94.6% |
| Immigrants | El Salvador | 0.0 /100 | #346 | Tragic 94.3% |