Immigrants from Ireland vs Seminole 5th Grade

COMPARE

Immigrants from Ireland
Race
Ancestry
AfghanAfricanAlaska NativeAlaskan AthabascanAlbanianAleutAlsatianAmericanApacheArabArapahoArgentineanArmenianAssyrian/Chaldean/SyriacAustralianAustrianBahamianBangladeshiBarbadianBasqueBelgianBelizeanBermudanBhutaneseBlackfeetBolivianBrazilianBritishBritish West IndianBulgarianBurmeseCajunCambodianCanadianCape VerdeanCarpatho RusynCelticCentral AmericanCentral American IndianCherokeeCheyenneChickasawChileanChineseChippewaChoctawColombianColvilleComancheCosta RicanCreeCreekCroatianCrowCubanCypriotCzechCzechoslovakianDanishDelawareDominicanDutchDutch West IndianEastern EuropeanEcuadorianEgyptianEnglishEstonianEthiopianEuropeanFijianFilipinoFinnishFrenchFrench American IndianFrench CanadianGermanGerman RussianGhanaianGreekGuamanian/ChamorroGuatemalanGuyaneseHaitianHmongHonduranHopiHoumaHungarianIcelanderIndian (Asian)IndonesianInupiatIranianIraqiIrishIroquoisIsraeliItalianJamaicanJapaneseJordanianKenyanKiowaKoreanLaotianLatvianLebaneseLiberianLithuanianLumbeeLuxembourgerMacedonianMalaysianMalteseMarshalleseMenomineeMexicanMexican American IndianMongolianMoroccanNative HawaiianNavajoNepaleseNew ZealanderNicaraguanNigerianNorthern EuropeanNorwegianOkinawanOsageOttawaPaiutePakistaniPalestinianPanamanianParaguayanPennsylvania GermanPeruvianPimaPolishPortuguesePotawatomiPuebloPuerto RicanPuget Sound SalishRomanianRussianSalvadoranSamoanScandinavianScotch-IrishScottishSenegaleseSerbianShoshoneSierra LeoneanSiouxSlavicSlovakSloveneSomaliSouth AfricanSouth AmericanSouth American IndianSoviet UnionSpaniardSpanishSpanish AmericanSpanish American IndianSri LankanSubsaharan AfricanSudaneseSwedishSwissSyrianTaiwaneseThaiTlingit-HaidaTohono O'OdhamTonganTrinidadian and TobagonianTsimshianTurkishU.S. Virgin IslanderUgandanUkrainianUruguayanUteVenezuelanVietnameseWelshWest IndianYakamaYaquiYugoslavianYumanYup'ikZimbabwean
Immigration
NonimmigrantsImmigrantsAfghanistanAfricaAlbaniaArgentinaArmeniaAsiaAustraliaAustriaBahamasBangladeshBarbadosBelarusBelgiumBelizeBoliviaBosnia and HerzegovinaBrazilBulgariaBurma/MyanmarCabo VerdeCambodiaCameroonCanadaCaribbeanCentral AmericaChileChinaColombiaCongoCosta RicaCroatiaCubaCzechoslovakiaDenmarkDominicaDominican RepublicEastern AfricaEastern AsiaEastern EuropeEcuadorEgyptEl SalvadorEnglandEritreaEthiopiaEuropeFijiFranceGermanyGhanaGreeceGrenadaGuatemalaGuyanaHaitiHondurasHong KongHungaryIndiaIndonesiaIranIraqIrelandIsraelItalyJamaicaJapanJordanKazakhstanKenyaKoreaKuwaitLaosLatin AmericaLatviaLebanonLiberiaLithuaniaMalaysiaMexicoMicronesiaMiddle AfricaMoldovaMoroccoNepalNetherlandsNicaraguaNigeriaNorth AmericaNorth MacedoniaNorthern AfricaNorthern EuropeNorwayOceaniaPakistanPanamaPeruPhilippinesPolandPortugalRomaniaRussiaSaudi ArabiaScotlandSenegalSerbiaSierra LeoneSingaporeSomaliaSouth AfricaSouth AmericaSouth Central AsiaSouth Eastern AsiaSouthern EuropeSpainSri LankaSt. Vincent and the GrenadinesSudanSwedenSwitzerlandSyriaTaiwanThailandTrinidad and TobagoTurkeyUgandaUkraineUruguayUzbekistanVenezuelaVietnamWest IndiesWestern AfricaWestern AsiaWestern EuropeYemenZaireZimbabweAzores
Seminole
Race
Ancestry
AfghanAfricanAlaska NativeAlaskan AthabascanAlbanianAleutAlsatianAmericanApacheArabArapahoArgentineanArmenianAssyrian/Chaldean/SyriacAustralianAustrianBahamianBangladeshiBarbadianBasqueBelgianBelizeanBermudanBhutaneseBlackfeetBolivianBrazilianBritishBritish West IndianBulgarianBurmeseCajunCambodianCanadianCape VerdeanCarpatho RusynCelticCentral AmericanCentral American IndianCherokeeCheyenneChickasawChileanChineseChippewaChoctawColombianColvilleComancheCosta RicanCreeCreekCroatianCrowCubanCypriotCzechCzechoslovakianDanishDelawareDominicanDutchDutch West IndianEastern EuropeanEcuadorianEgyptianEnglishEstonianEthiopianEuropeanFijianFilipinoFinnishFrenchFrench American IndianFrench CanadianGermanGerman RussianGhanaianGreekGuamanian/ChamorroGuatemalanGuyaneseHaitianHmongHonduranHopiHoumaHungarianIcelanderIndian (Asian)IndonesianInupiatIranianIraqiIrishIroquoisIsraeliItalianJamaicanJapaneseJordanianKenyanKiowaKoreanLaotianLatvianLebaneseLiberianLithuanianLumbeeLuxembourgerMacedonianMalaysianMalteseMarshalleseMenomineeMexicanMexican American IndianMongolianMoroccanNative HawaiianNavajoNepaleseNew ZealanderNicaraguanNigerianNorthern EuropeanNorwegianOkinawanOsageOttawaPaiutePakistaniPalestinianPanamanianParaguayanPennsylvania GermanPeruvianPimaPolishPortuguesePotawatomiPuebloPuerto RicanPuget Sound SalishRomanianRussianSalvadoranSamoanScandinavianScotch-IrishScottishSeminoleSenegaleseSerbianShoshoneSierra LeoneanSiouxSlavicSlovakSloveneSomaliSouth AfricanSouth AmericanSouth American IndianSoviet UnionSpaniardSpanishSpanish AmericanSpanish American IndianSri LankanSubsaharan AfricanSudaneseSwedishSwissSyrianTaiwaneseThaiTlingit-HaidaTohono O'OdhamTonganTrinidadian and TobagonianTsimshianTurkishU.S. Virgin IslanderUgandanUkrainianUruguayanUteVenezuelanVietnameseWelshWest IndianYakamaYaquiYugoslavianYumanYup'ikZimbabwean
Immigration
NonimmigrantsImmigrantsAfghanistanAfricaAlbaniaArgentinaArmeniaAsiaAustraliaAustriaBahamasBangladeshBarbadosBelarusBelgiumBelizeBoliviaBosnia and HerzegovinaBrazilBulgariaBurma/MyanmarCabo VerdeCambodiaCameroonCanadaCaribbeanCentral AmericaChileChinaColombiaCongoCosta RicaCroatiaCubaCzechoslovakiaDenmarkDominicaDominican RepublicEastern AfricaEastern AsiaEastern EuropeEcuadorEgyptEl SalvadorEnglandEritreaEthiopiaEuropeFijiFranceGermanyGhanaGreeceGrenadaGuatemalaGuyanaHaitiHondurasHong KongHungaryIndiaIndonesiaIranIraqIsraelItalyJamaicaJapanJordanKazakhstanKenyaKoreaKuwaitLaosLatin AmericaLatviaLebanonLiberiaLithuaniaMalaysiaMexicoMicronesiaMiddle AfricaMoldovaMoroccoNepalNetherlandsNicaraguaNigeriaNorth AmericaNorth MacedoniaNorthern AfricaNorthern EuropeNorwayOceaniaPakistanPanamaPeruPhilippinesPolandPortugalRomaniaRussiaSaudi ArabiaScotlandSenegalSerbiaSierra LeoneSingaporeSomaliaSouth AfricaSouth AmericaSouth Central AsiaSouth Eastern AsiaSouthern EuropeSpainSri LankaSt. Vincent and the GrenadinesSudanSwedenSwitzerlandSyriaTaiwanThailandTrinidad and TobagoTurkeyUgandaUkraineUruguayUzbekistanVenezuelaVietnamWest IndiesWestern AfricaWestern AsiaWestern EuropeYemenZaireZimbabweAzores
5th Grade
Income
Poverty
Unemployment
Labor Participation
Family Structure
Vehicle Availability
Education Level
Disability

5th Grade Comparison

Immigrants from Ireland

Seminole

Exceptional
Excellent
97.8%
5TH GRADE
98.8/ 100
METRIC RATING
90th/ 347
METRIC RANK
97.5%
5TH GRADE
85.8/ 100
METRIC RATING
141st/ 347
METRIC RANK

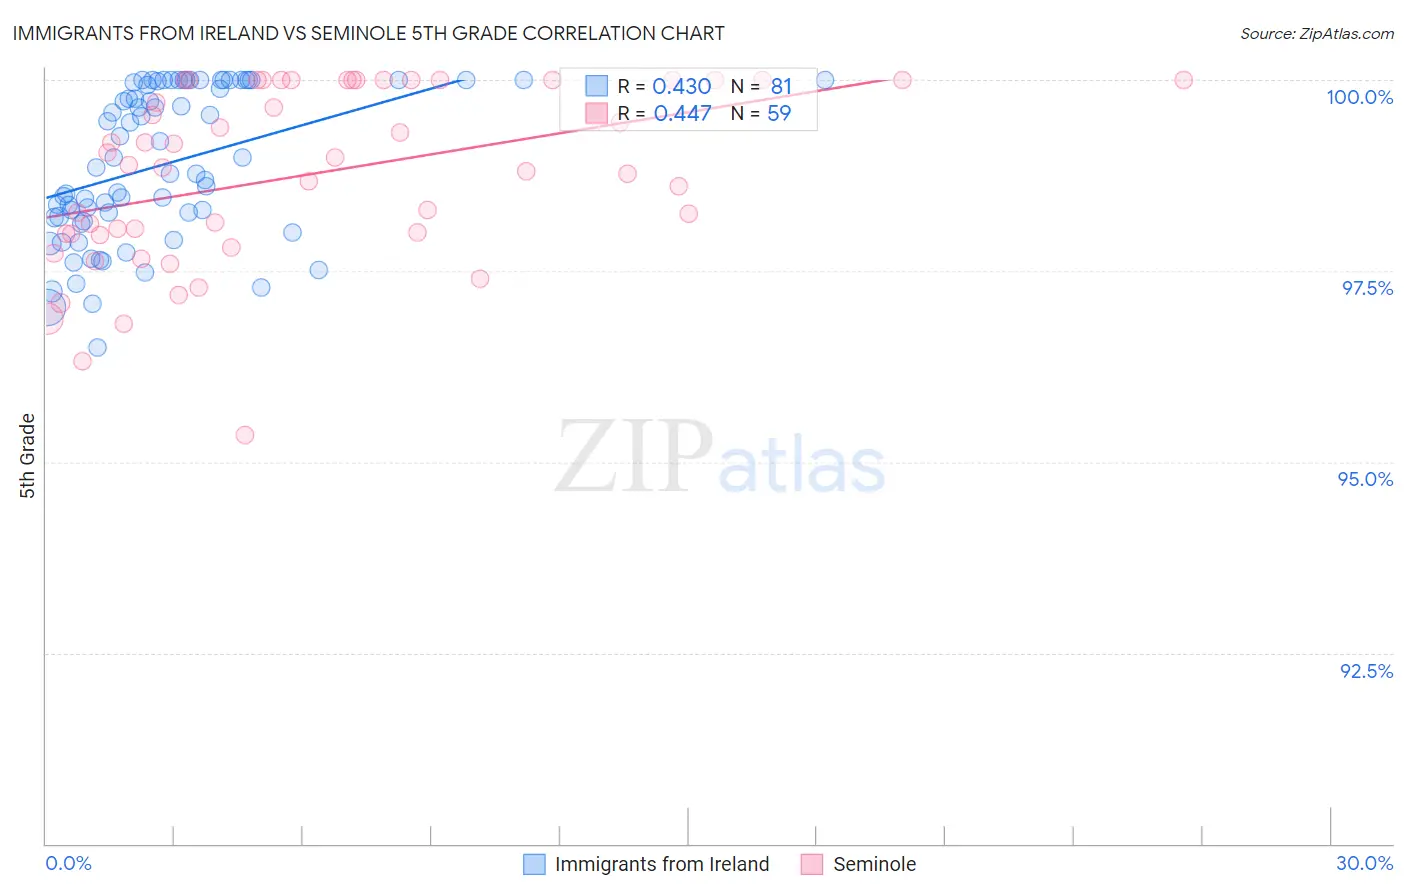
Immigrants from Ireland vs Seminole 5th Grade Correlation Chart

The statistical analysis conducted on geographies consisting of 240,784,498 people shows a moderate positive correlation between the proportion of Immigrants from Ireland and percentage of population with at least 5th grade education in the United States with a correlation coefficient (R) of 0.430 and weighted average of 97.8%. Similarly, the statistical analysis conducted on geographies consisting of 118,313,204 people shows a moderate positive correlation between the proportion of Seminole and percentage of population with at least 5th grade education in the United States with a correlation coefficient (R) of 0.447 and weighted average of 97.5%, a difference of 0.27%.
Immigrants from Ireland vs Seminole 5th Grade

5th Grade Correlation Summary

MeasurementImmigrants from IrelandSeminole
Minimum96.5%95.3%
Maximum100.0%100.0%
Range3.5%4.7%
Mean98.9%98.8%
Median98.8%98.9%
Interquartile 25% (IQ1)98.2%98.0%
Interquartile 75% (IQ3)100.0%100.0%
Interquartile Range (IQR)1.8%2.0%
Standard Deviation (Sample)0.99%1.2%
Standard Deviation (Population)0.98%1.1%

Similar Demographics by 5th Grade

Demographics Similar to Immigrants from Ireland by 5th Grade

In terms of 5th grade, the demographic groups most similar to Immigrants from Ireland are Immigrants from Australia (97.8%, a difference of 0.0%), Shoshone (97.8%, a difference of 0.0%), Immigrants from South Africa (97.8%, a difference of 0.0%), Immigrants from Western Europe (97.8%, a difference of 0.0%), and Cypriot (97.8%, a difference of 0.010%).
DemographicsRating | Rank5th Grade
Zimbabweans
99.0
/100
|
#83
Exceptional
97.8%
Potawatomi
99.0
/100
|
#84
Exceptional
97.8%
Immigrants | Belgium
99.0
/100
|
#85
Exceptional
97.8%
Cypriots
98.9
/100
|
#86
Exceptional
97.8%
Immigrants | Australia
98.8
/100
|
#87
Exceptional
97.8%
Shoshone
98.8
/100
|
#88
Exceptional
97.8%
Immigrants | South Africa
98.8
/100
|
#89
Exceptional
97.8%
Immigrants | Ireland
98.8
/100
|
#90
Exceptional
97.8%
Immigrants | Western Europe
98.8
/100
|
#91
Exceptional
97.8%
Immigrants | Sweden
98.7
/100
|
#92
Exceptional
97.8%
Delaware
98.6
/100
|
#93
Exceptional
97.8%
Immigrants | Denmark
98.6
/100
|
#94
Exceptional
97.8%
Romanians
98.6
/100
|
#95
Exceptional
97.8%
Immigrants | Germany
98.5
/100
|
#96
Exceptional
97.8%
Cree
98.4
/100
|
#97
Exceptional
97.7%

Demographics Similar to Seminole by 5th Grade

In terms of 5th grade, the demographic groups most similar to Seminole are Burmese (97.5%, a difference of 0.0%), Israeli (97.5%, a difference of 0.0%), Immigrants from North Macedonia (97.5%, a difference of 0.0%), Filipino (97.5%, a difference of 0.010%), and Blackfeet (97.5%, a difference of 0.010%).
DemographicsRating | Rank5th Grade
Immigrants | Hungary
90.1
/100
|
#134
Exceptional
97.6%
Palestinians
89.3
/100
|
#135
Excellent
97.5%
Immigrants | Moldova
87.5
/100
|
#136
Excellent
97.5%
Filipinos
86.8
/100
|
#137
Excellent
97.5%
Blackfeet
86.8
/100
|
#138
Excellent
97.5%
Immigrants | Turkey
86.7
/100
|
#139
Excellent
97.5%
Burmese
86.1
/100
|
#140
Excellent
97.5%
Seminole
85.8
/100
|
#141
Excellent
97.5%
Israelis
85.5
/100
|
#142
Excellent
97.5%
Immigrants | North Macedonia
85.4
/100
|
#143
Excellent
97.5%
Immigrants | Greece
83.2
/100
|
#144
Excellent
97.5%
Jordanians
82.6
/100
|
#145
Excellent
97.5%
Spaniards
81.9
/100
|
#146
Excellent
97.5%
Soviet Union
81.2
/100
|
#147
Excellent
97.5%
Immigrants | Israel
79.1
/100
|
#148
Good
97.5%