Immigrants from Ireland vs Celtic College, Under 1 year
COMPARE
Immigrants from Ireland
Celtic
College, Under 1 year
College, Under 1 year Comparison
Immigrants from Ireland
Celtics
71.0%
COLLEGE, UNDER 1 YEAR
100.0/ 100
METRIC RATING
27th/ 347
METRIC RANK
65.9%
COLLEGE, UNDER 1 YEAR
67.3/ 100
METRIC RATING
158th/ 347
METRIC RANK
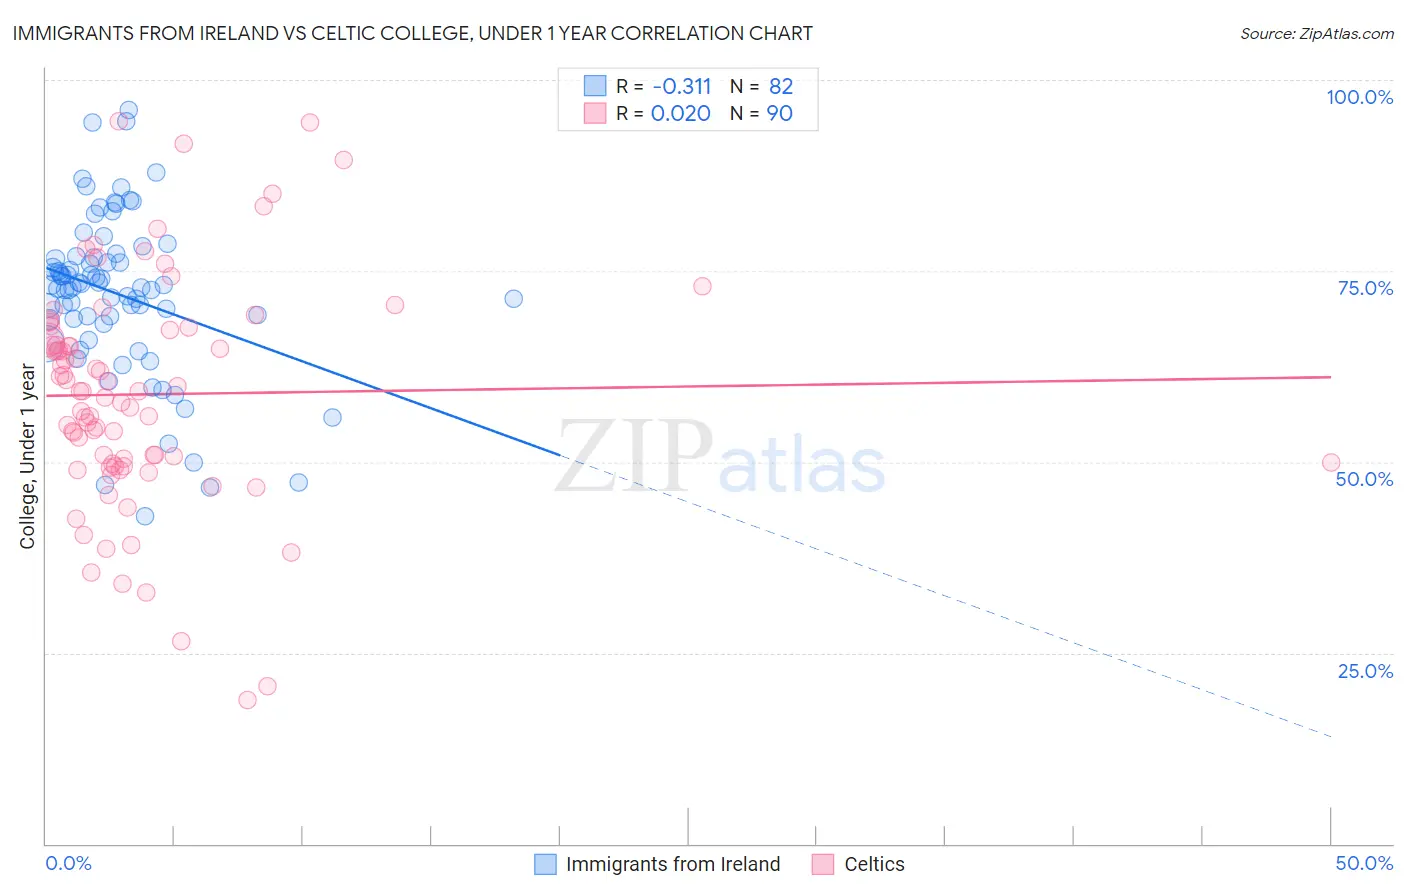
Immigrants from Ireland vs Celtic College, Under 1 year Correlation Chart
The statistical analysis conducted on geographies consisting of 240,784,591 people shows a mild negative correlation between the proportion of Immigrants from Ireland and percentage of population with at least college, under 1 year education in the United States with a correlation coefficient (R) of -0.311 and weighted average of 71.0%. Similarly, the statistical analysis conducted on geographies consisting of 168,877,347 people shows no correlation between the proportion of Celtics and percentage of population with at least college, under 1 year education in the United States with a correlation coefficient (R) of 0.020 and weighted average of 65.9%, a difference of 7.7%.
College, Under 1 year Correlation Summary
| Measurement | Immigrants from Ireland | Celtic |
| Minimum | 42.8% | 18.7% |
| Maximum | 96.0% | 94.6% |
| Range | 53.2% | 75.9% |
| Mean | 72.0% | 58.8% |
| Median | 73.0% | 59.3% |
| Interquartile 25% (IQ1) | 68.7% | 49.8% |
| Interquartile 75% (IQ3) | 76.8% | 67.2% |
| Interquartile Range (IQR) | 8.1% | 17.4% |
| Standard Deviation (Sample) | 10.6% | 14.9% |
| Standard Deviation (Population) | 10.5% | 14.8% |
Similar Demographics by College, Under 1 year
Demographics Similar to Immigrants from Ireland by College, Under 1 year
In terms of college, under 1 year, the demographic groups most similar to Immigrants from Ireland are Immigrants from Denmark (71.0%, a difference of 0.010%), Immigrants from Hong Kong (71.0%, a difference of 0.030%), Immigrants from France (71.0%, a difference of 0.030%), Bulgarian (71.1%, a difference of 0.13%), and Soviet Union (71.1%, a difference of 0.14%).
| Demographics | Rating | Rank | College, Under 1 year |
| Immigrants | Korea | 100.0 /100 | #20 | Exceptional 71.6% |
| Immigrants | Belgium | 100.0 /100 | #21 | Exceptional 71.5% |
| Immigrants | Eastern Asia | 100.0 /100 | #22 | Exceptional 71.3% |
| Immigrants | Northern Europe | 100.0 /100 | #23 | Exceptional 71.1% |
| Soviet Union | 100.0 /100 | #24 | Exceptional 71.1% |
| Bulgarians | 100.0 /100 | #25 | Exceptional 71.1% |
| Immigrants | Denmark | 100.0 /100 | #26 | Exceptional 71.0% |
| Immigrants | Ireland | 100.0 /100 | #27 | Exceptional 71.0% |
| Immigrants | Hong Kong | 100.0 /100 | #28 | Exceptional 71.0% |
| Immigrants | France | 100.0 /100 | #29 | Exceptional 71.0% |
| Immigrants | China | 99.9 /100 | #30 | Exceptional 70.9% |
| Indians (Asian) | 99.9 /100 | #31 | Exceptional 70.8% |
| Turks | 99.9 /100 | #32 | Exceptional 70.7% |
| Immigrants | South Africa | 99.9 /100 | #33 | Exceptional 70.6% |
| Estonians | 99.9 /100 | #34 | Exceptional 70.6% |
Demographics Similar to Celtics by College, Under 1 year
In terms of college, under 1 year, the demographic groups most similar to Celtics are Sierra Leonean (66.0%, a difference of 0.030%), Tlingit-Haida (65.9%, a difference of 0.050%), Albanian (65.9%, a difference of 0.060%), Brazilian (65.9%, a difference of 0.070%), and Korean (65.9%, a difference of 0.10%).
| Demographics | Rating | Rank | College, Under 1 year |
| Immigrants | Sudan | 76.0 /100 | #151 | Good 66.2% |
| Sudanese | 74.1 /100 | #152 | Good 66.2% |
| Belgians | 73.7 /100 | #153 | Good 66.2% |
| Immigrants | Eritrea | 71.9 /100 | #154 | Good 66.1% |
| Irish | 70.3 /100 | #155 | Good 66.0% |
| Welsh | 69.9 /100 | #156 | Good 66.0% |
| Sierra Leoneans | 67.8 /100 | #157 | Good 66.0% |
| Celtics | 67.3 /100 | #158 | Good 65.9% |
| Tlingit-Haida | 66.4 /100 | #159 | Good 65.9% |
| Albanians | 66.1 /100 | #160 | Good 65.9% |
| Brazilians | 66.0 /100 | #161 | Good 65.9% |
| Koreans | 65.3 /100 | #162 | Good 65.9% |
| Somalis | 62.7 /100 | #163 | Good 65.8% |
| Czechoslovakians | 62.6 /100 | #164 | Good 65.8% |
| Immigrants | Uzbekistan | 61.6 /100 | #165 | Good 65.8% |