Immigrants from Iraq vs Immigrants from Sri Lanka 11th Grade
COMPARE
Immigrants from Iraq
Immigrants from Sri Lanka
11th Grade
11th Grade Comparison
Immigrants from Iraq
Immigrants from Sri Lanka
92.6%
11TH GRADE
63.7/ 100
METRIC RATING
165th/ 347
METRIC RANK
93.2%
11TH GRADE
95.6/ 100
METRIC RATING
125th/ 347
METRIC RANK
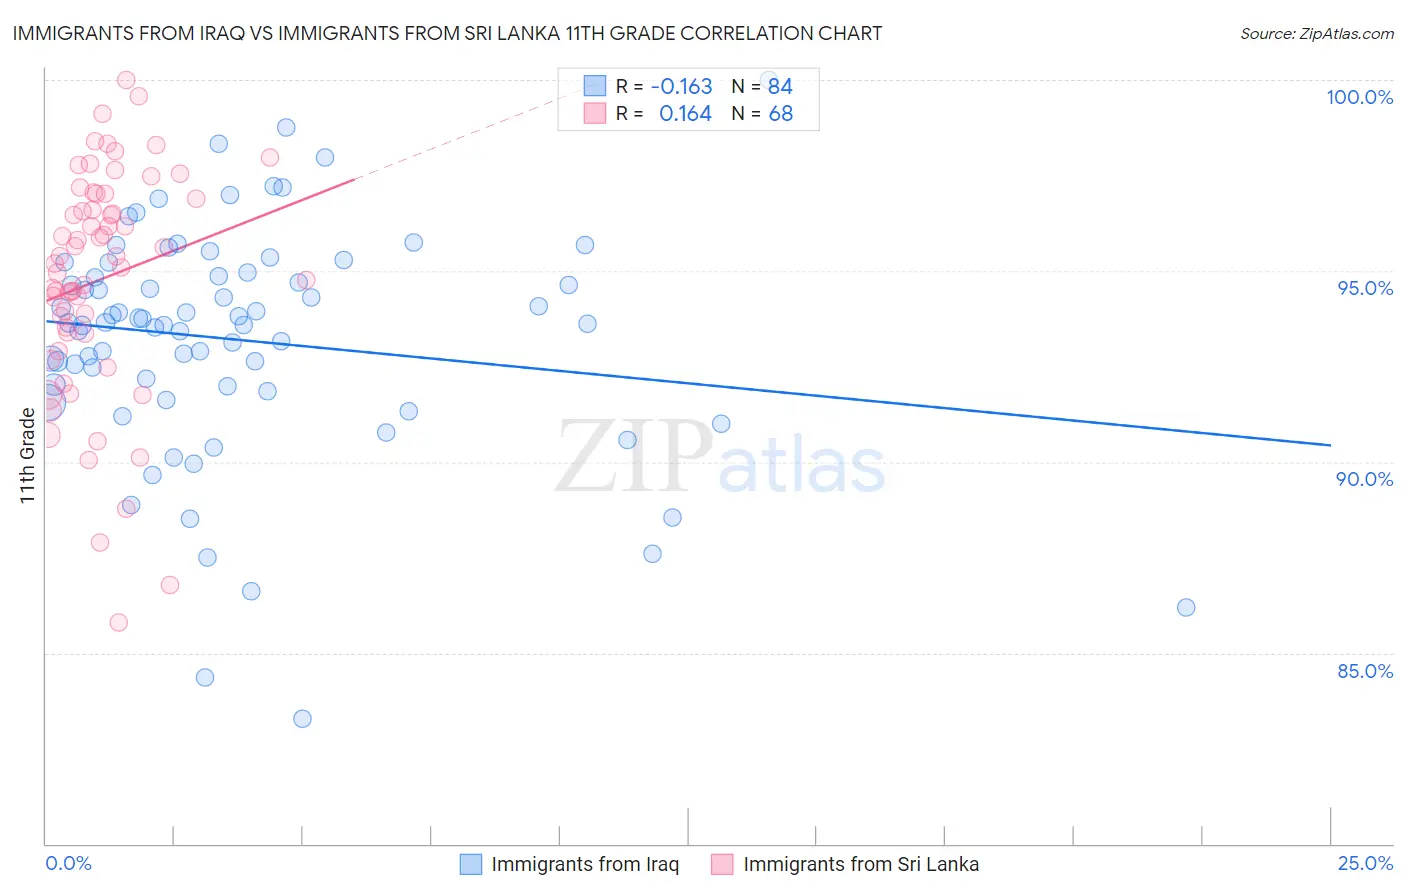
Immigrants from Iraq vs Immigrants from Sri Lanka 11th Grade Correlation Chart
The statistical analysis conducted on geographies consisting of 194,685,376 people shows a poor negative correlation between the proportion of Immigrants from Iraq and percentage of population with at least 11th grade education in the United States with a correlation coefficient (R) of -0.163 and weighted average of 92.6%. Similarly, the statistical analysis conducted on geographies consisting of 149,660,761 people shows a poor positive correlation between the proportion of Immigrants from Sri Lanka and percentage of population with at least 11th grade education in the United States with a correlation coefficient (R) of 0.164 and weighted average of 93.2%, a difference of 0.62%.
11th Grade Correlation Summary
| Measurement | Immigrants from Iraq | Immigrants from Sri Lanka |
| Minimum | 83.3% | 85.8% |
| Maximum | 100.0% | 100.0% |
| Range | 16.7% | 14.2% |
| Mean | 93.2% | 94.8% |
| Median | 93.6% | 95.3% |
| Interquartile 25% (IQ1) | 91.9% | 93.4% |
| Interquartile 75% (IQ3) | 94.9% | 97.0% |
| Interquartile Range (IQR) | 3.0% | 3.6% |
| Standard Deviation (Sample) | 3.0% | 3.0% |
| Standard Deviation (Population) | 3.0% | 3.0% |
Similar Demographics by 11th Grade
Demographics Similar to Immigrants from Iraq by 11th Grade
In terms of 11th grade, the demographic groups most similar to Immigrants from Iraq are Bermudan (92.6%, a difference of 0.010%), Nonimmigrants (92.7%, a difference of 0.030%), Spanish (92.7%, a difference of 0.030%), Alsatian (92.6%, a difference of 0.040%), and Paraguayan (92.7%, a difference of 0.050%).
| Demographics | Rating | Rank | 11th Grade |
| Immigrants | Venezuela | 72.0 /100 | #158 | Good 92.7% |
| Americans | 71.7 /100 | #159 | Good 92.7% |
| Immigrants | Lebanon | 70.7 /100 | #160 | Good 92.7% |
| Immigrants | Argentina | 69.8 /100 | #161 | Good 92.7% |
| Paraguayans | 68.7 /100 | #162 | Good 92.7% |
| Immigrants | Nonimmigrants | 66.6 /100 | #163 | Good 92.7% |
| Spanish | 66.2 /100 | #164 | Good 92.7% |
| Immigrants | Iraq | 63.7 /100 | #165 | Good 92.6% |
| Bermudans | 62.3 /100 | #166 | Good 92.6% |
| Alsatians | 60.2 /100 | #167 | Good 92.6% |
| Sierra Leoneans | 58.7 /100 | #168 | Average 92.6% |
| Immigrants | Albania | 57.8 /100 | #169 | Average 92.6% |
| Immigrants | Northern Africa | 57.3 /100 | #170 | Average 92.6% |
| Laotians | 54.4 /100 | #171 | Average 92.6% |
| Immigrants | Pakistan | 52.3 /100 | #172 | Average 92.5% |
Demographics Similar to Immigrants from Sri Lanka by 11th Grade
In terms of 11th grade, the demographic groups most similar to Immigrants from Sri Lanka are Immigrants from Greece (93.2%, a difference of 0.020%), Immigrants from Eastern Europe (93.2%, a difference of 0.020%), Basque (93.2%, a difference of 0.020%), Immigrants from Belarus (93.3%, a difference of 0.040%), and German Russian (93.3%, a difference of 0.050%).
| Demographics | Rating | Rank | 11th Grade |
| Immigrants | Korea | 97.0 /100 | #118 | Exceptional 93.3% |
| Israelis | 97.0 /100 | #119 | Exceptional 93.3% |
| Immigrants | Russia | 96.6 /100 | #120 | Exceptional 93.3% |
| German Russians | 96.4 /100 | #121 | Exceptional 93.3% |
| Immigrants | Belarus | 96.3 /100 | #122 | Exceptional 93.3% |
| Immigrants | Greece | 95.9 /100 | #123 | Exceptional 93.2% |
| Immigrants | Eastern Europe | 95.9 /100 | #124 | Exceptional 93.2% |
| Immigrants | Sri Lanka | 95.6 /100 | #125 | Exceptional 93.2% |
| Basques | 95.2 /100 | #126 | Exceptional 93.2% |
| Immigrants | Kazakhstan | 92.4 /100 | #127 | Exceptional 93.1% |
| Immigrants | Jordan | 92.4 /100 | #128 | Exceptional 93.1% |
| Immigrants | Ukraine | 89.8 /100 | #129 | Excellent 93.0% |
| Albanians | 89.5 /100 | #130 | Excellent 93.0% |
| Egyptians | 89.5 /100 | #131 | Excellent 93.0% |
| Immigrants | Bosnia and Herzegovina | 89.0 /100 | #132 | Excellent 93.0% |