Immigrants from Iraq vs Delaware Bachelor's Degree
COMPARE
Immigrants from Iraq
Delaware
Bachelor's Degree
Bachelor's Degree Comparison
Immigrants from Iraq
Delaware
37.9%
BACHELOR'S DEGREE
52.5/ 100
METRIC RATING
173rd/ 347
METRIC RANK
33.8%
BACHELOR'S DEGREE
1.2/ 100
METRIC RATING
244th/ 347
METRIC RANK
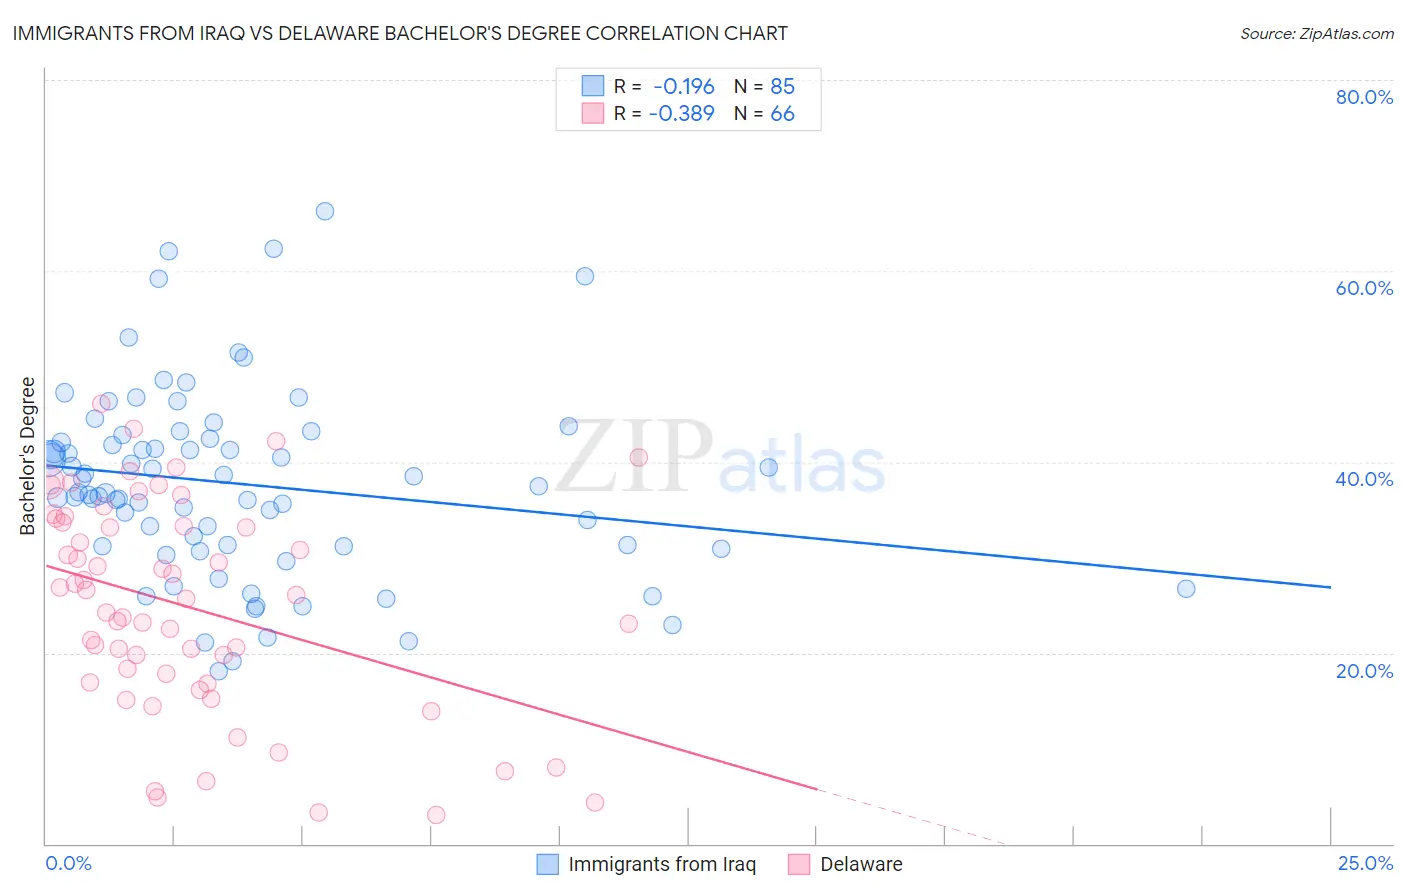
Immigrants from Iraq vs Delaware Bachelor's Degree Correlation Chart
The statistical analysis conducted on geographies consisting of 194,775,437 people shows a poor negative correlation between the proportion of Immigrants from Iraq and percentage of population with at least bachelor's degree education in the United States with a correlation coefficient (R) of -0.196 and weighted average of 37.9%. Similarly, the statistical analysis conducted on geographies consisting of 96,234,889 people shows a mild negative correlation between the proportion of Delaware and percentage of population with at least bachelor's degree education in the United States with a correlation coefficient (R) of -0.389 and weighted average of 33.8%, a difference of 12.3%.
Bachelor's Degree Correlation Summary
| Measurement | Immigrants from Iraq | Delaware |
| Minimum | 18.0% | 3.0% |
| Maximum | 66.3% | 46.1% |
| Range | 48.3% | 43.0% |
| Mean | 37.7% | 24.8% |
| Median | 36.8% | 25.8% |
| Interquartile 25% (IQ1) | 31.2% | 16.9% |
| Interquartile 75% (IQ3) | 42.7% | 33.6% |
| Interquartile Range (IQR) | 11.5% | 16.7% |
| Standard Deviation (Sample) | 9.9% | 11.0% |
| Standard Deviation (Population) | 9.8% | 11.0% |
Similar Demographics by Bachelor's Degree
Demographics Similar to Immigrants from Iraq by Bachelor's Degree
In terms of bachelor's degree, the demographic groups most similar to Immigrants from Iraq are Immigrants from Somalia (37.9%, a difference of 0.020%), Bermudan (38.0%, a difference of 0.16%), Czech (38.0%, a difference of 0.18%), Immigrants from Bangladesh (37.8%, a difference of 0.25%), and Ghanaian (38.0%, a difference of 0.27%).
| Demographics | Rating | Rank | Bachelor's Degree |
| Somalis | 58.6 /100 | #166 | Average 38.1% |
| Scottish | 56.6 /100 | #167 | Average 38.1% |
| Danes | 56.2 /100 | #168 | Average 38.1% |
| Ghanaians | 55.3 /100 | #169 | Average 38.0% |
| Czechs | 54.4 /100 | #170 | Average 38.0% |
| Bermudans | 54.2 /100 | #171 | Average 38.0% |
| Immigrants | Somalia | 52.8 /100 | #172 | Average 37.9% |
| Immigrants | Iraq | 52.5 /100 | #173 | Average 37.9% |
| Immigrants | Bangladesh | 50.0 /100 | #174 | Average 37.8% |
| Immigrants | Uruguay | 48.3 /100 | #175 | Average 37.8% |
| Costa Ricans | 47.6 /100 | #176 | Average 37.7% |
| Basques | 47.4 /100 | #177 | Average 37.7% |
| Immigrants | Cameroon | 46.8 /100 | #178 | Average 37.7% |
| Immigrants | Colombia | 45.4 /100 | #179 | Average 37.7% |
| Irish | 44.3 /100 | #180 | Average 37.6% |
Demographics Similar to Delaware by Bachelor's Degree
In terms of bachelor's degree, the demographic groups most similar to Delaware are Immigrants from Fiji (33.7%, a difference of 0.090%), Jamaican (33.6%, a difference of 0.45%), Immigrants from Guyana (33.9%, a difference of 0.50%), Immigrants from Congo (33.6%, a difference of 0.54%), and Cree (33.6%, a difference of 0.56%).
| Demographics | Rating | Rank | Bachelor's Degree |
| Tlingit-Haida | 2.8 /100 | #237 | Tragic 34.6% |
| Guyanese | 2.5 /100 | #238 | Tragic 34.5% |
| British West Indians | 2.5 /100 | #239 | Tragic 34.5% |
| Tongans | 2.0 /100 | #240 | Tragic 34.3% |
| Immigrants | Cambodia | 1.9 /100 | #241 | Tragic 34.2% |
| Immigrants | Nonimmigrants | 1.8 /100 | #242 | Tragic 34.2% |
| Immigrants | Guyana | 1.4 /100 | #243 | Tragic 33.9% |
| Delaware | 1.2 /100 | #244 | Tragic 33.8% |
| Immigrants | Fiji | 1.2 /100 | #245 | Tragic 33.7% |
| Jamaicans | 1.0 /100 | #246 | Tragic 33.6% |
| Immigrants | Congo | 1.0 /100 | #247 | Tragic 33.6% |
| Cree | 1.0 /100 | #248 | Tragic 33.6% |
| Immigrants | Liberia | 0.9 /100 | #249 | Tragic 33.5% |
| Indonesians | 0.9 /100 | #250 | Tragic 33.5% |
| Japanese | 0.7 /100 | #251 | Tragic 33.3% |