Immigrants from Philippines vs Shoshone High School Diploma
COMPARE
Immigrants from Philippines
Shoshone
High School Diploma
High School Diploma Comparison
Immigrants from Philippines
Shoshone
87.8%
HIGH SCHOOL DIPLOMA
1.9/ 100
METRIC RATING
243rd/ 347
METRIC RANK
88.3%
HIGH SCHOOL DIPLOMA
7.0/ 100
METRIC RATING
224th/ 347
METRIC RANK
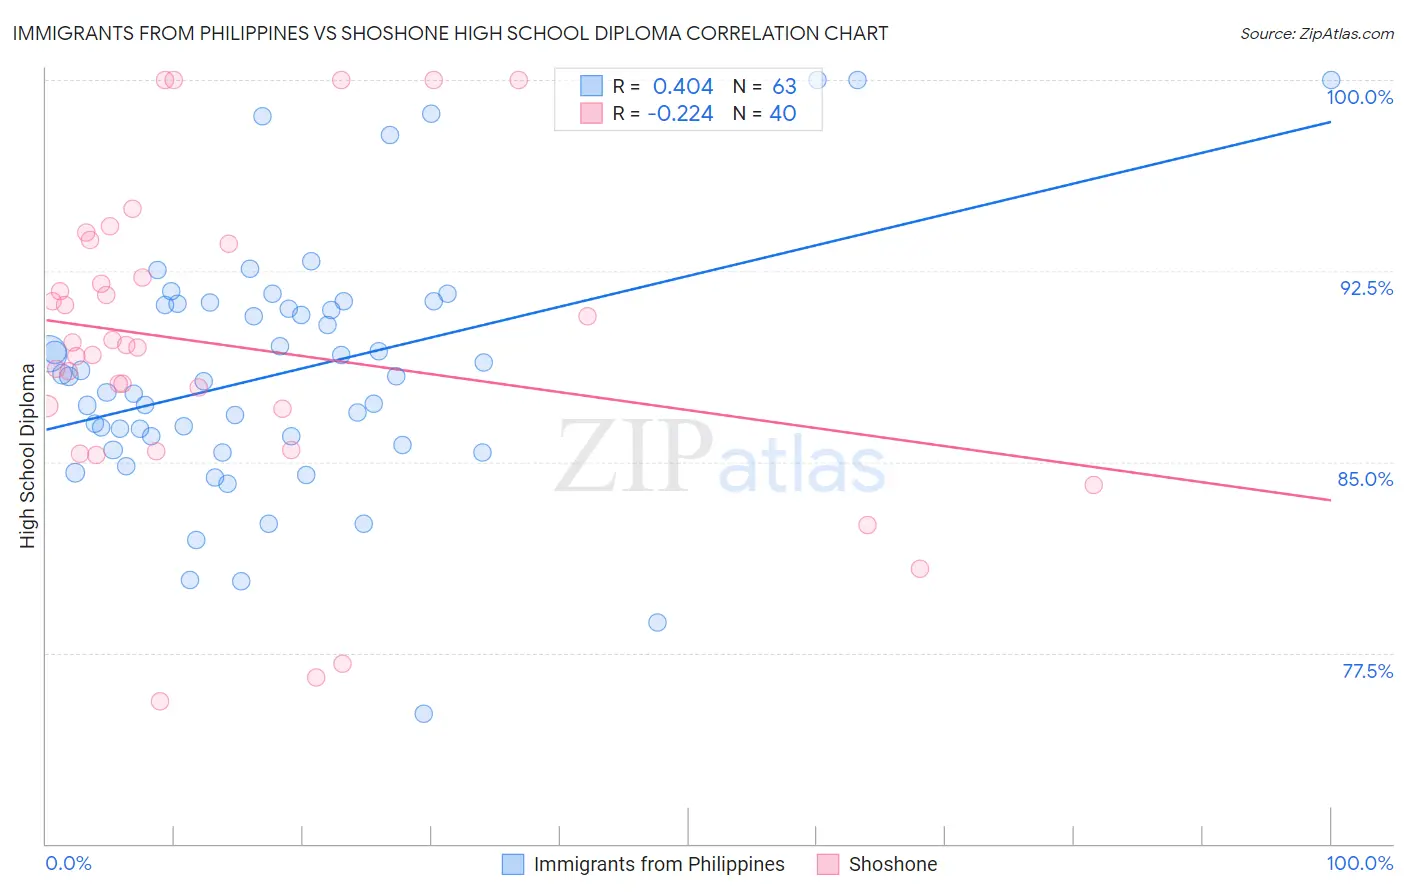
Immigrants from Philippines vs Shoshone High School Diploma Correlation Chart
The statistical analysis conducted on geographies consisting of 471,300,535 people shows a moderate positive correlation between the proportion of Immigrants from Philippines and percentage of population with at least high school diploma education in the United States with a correlation coefficient (R) of 0.404 and weighted average of 87.8%. Similarly, the statistical analysis conducted on geographies consisting of 66,627,351 people shows a weak negative correlation between the proportion of Shoshone and percentage of population with at least high school diploma education in the United States with a correlation coefficient (R) of -0.224 and weighted average of 88.3%, a difference of 0.51%.
High School Diploma Correlation Summary
| Measurement | Immigrants from Philippines | Shoshone |
| Minimum | 75.1% | 75.6% |
| Maximum | 100.0% | 100.0% |
| Range | 24.9% | 24.4% |
| Mean | 88.5% | 89.5% |
| Median | 88.3% | 89.5% |
| Interquartile 25% (IQ1) | 85.7% | 86.3% |
| Interquartile 75% (IQ3) | 91.2% | 92.9% |
| Interquartile Range (IQR) | 5.6% | 6.6% |
| Standard Deviation (Sample) | 5.0% | 6.1% |
| Standard Deviation (Population) | 4.9% | 6.0% |
Demographics Similar to Immigrants from Philippines and Shoshone by High School Diploma
In terms of high school diploma, the demographic groups most similar to Immigrants from Philippines are Immigrants from Uzbekistan (87.8%, a difference of 0.020%), Cheyenne (87.8%, a difference of 0.020%), Comanche (87.9%, a difference of 0.050%), Sioux (87.9%, a difference of 0.13%), and South American (87.9%, a difference of 0.13%). Similarly, the demographic groups most similar to Shoshone are Creek (88.3%, a difference of 0.010%), Immigrants from Zaire (88.3%, a difference of 0.040%), Uruguayan (88.2%, a difference of 0.090%), Immigrants from Liberia (88.2%, a difference of 0.10%), and Kiowa (88.2%, a difference of 0.11%).
| Demographics | Rating | Rank | High School Diploma |
| Immigrants | Zaire | 7.6 /100 | #223 | Tragic 88.3% |
| Shoshone | 7.0 /100 | #224 | Tragic 88.3% |
| Creek | 6.9 /100 | #225 | Tragic 88.3% |
| Uruguayans | 5.6 /100 | #226 | Tragic 88.2% |
| Immigrants | Liberia | 5.5 /100 | #227 | Tragic 88.2% |
| Kiowa | 5.3 /100 | #228 | Tragic 88.2% |
| Nigerians | 5.2 /100 | #229 | Tragic 88.2% |
| Blackfeet | 4.2 /100 | #230 | Tragic 88.1% |
| Colombians | 3.8 /100 | #231 | Tragic 88.1% |
| Immigrants | Middle Africa | 3.4 /100 | #232 | Tragic 88.0% |
| Immigrants | Panama | 3.1 /100 | #233 | Tragic 88.0% |
| Immigrants | Thailand | 3.1 /100 | #234 | Tragic 88.0% |
| Immigrants | Bahamas | 2.9 /100 | #235 | Tragic 88.0% |
| Sub-Saharan Africans | 2.8 /100 | #236 | Tragic 87.9% |
| Taiwanese | 2.8 /100 | #237 | Tragic 87.9% |
| Sioux | 2.7 /100 | #238 | Tragic 87.9% |
| South Americans | 2.7 /100 | #239 | Tragic 87.9% |
| Comanche | 2.2 /100 | #240 | Tragic 87.9% |
| Immigrants | Uzbekistan | 2.1 /100 | #241 | Tragic 87.8% |
| Cheyenne | 2.1 /100 | #242 | Tragic 87.8% |
| Immigrants | Philippines | 1.9 /100 | #243 | Tragic 87.8% |