Immigrants from Iran vs Cherokee Bachelor's Degree
COMPARE
Immigrants from Iran
Cherokee
Bachelor's Degree
Bachelor's Degree Comparison
Immigrants from Iran
Cherokee
50.3%
BACHELOR'S DEGREE
100.0/ 100
METRIC RATING
7th/ 347
METRIC RANK
30.2%
BACHELOR'S DEGREE
0.0/ 100
METRIC RATING
304th/ 347
METRIC RANK
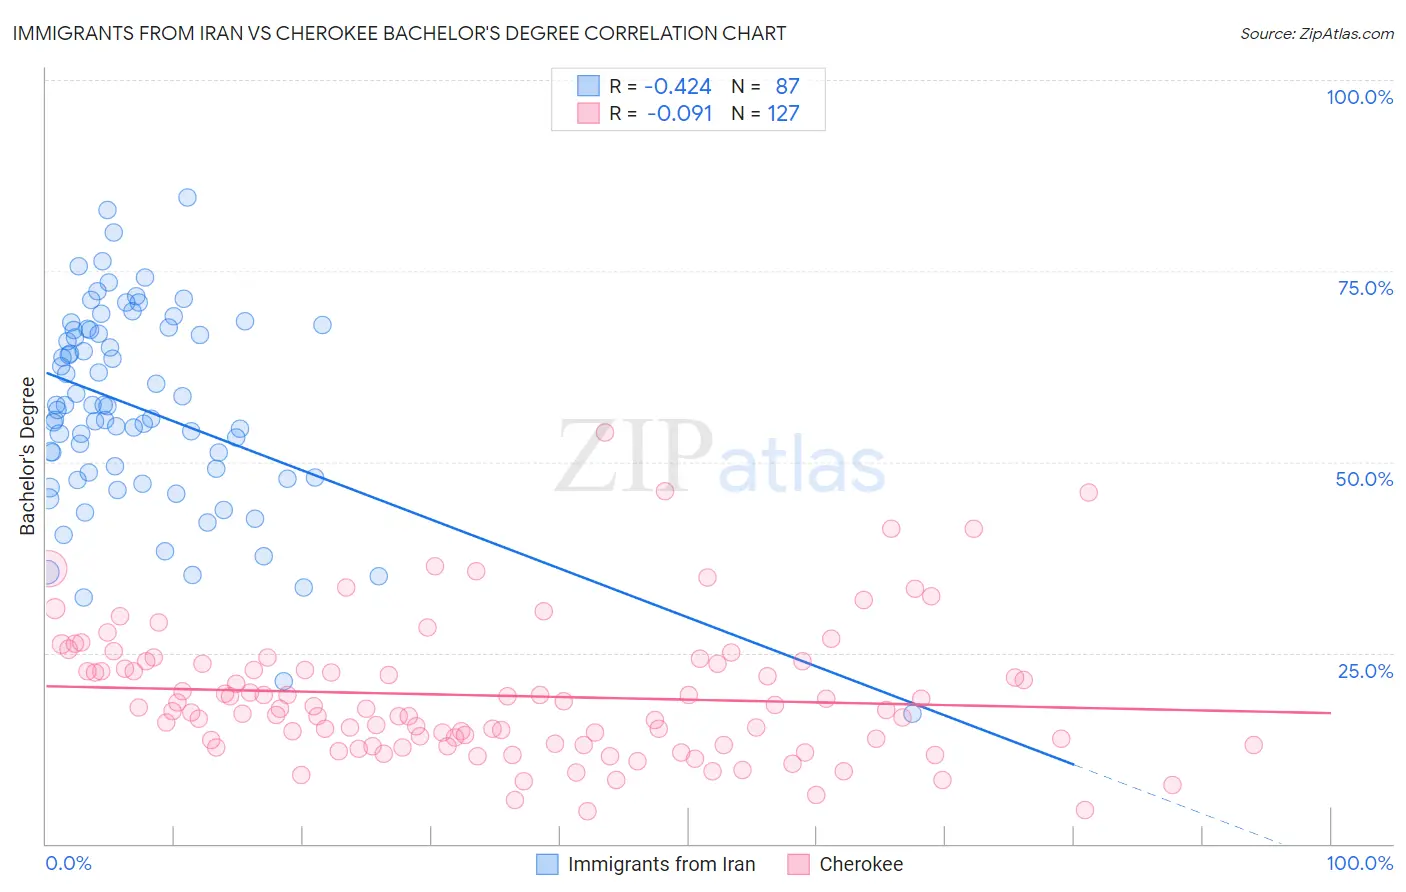
Immigrants from Iran vs Cherokee Bachelor's Degree Correlation Chart
The statistical analysis conducted on geographies consisting of 279,901,674 people shows a moderate negative correlation between the proportion of Immigrants from Iran and percentage of population with at least bachelor's degree education in the United States with a correlation coefficient (R) of -0.424 and weighted average of 50.3%. Similarly, the statistical analysis conducted on geographies consisting of 493,657,197 people shows a slight negative correlation between the proportion of Cherokee and percentage of population with at least bachelor's degree education in the United States with a correlation coefficient (R) of -0.091 and weighted average of 30.2%, a difference of 66.6%.
Bachelor's Degree Correlation Summary
| Measurement | Immigrants from Iran | Cherokee |
| Minimum | 17.0% | 4.3% |
| Maximum | 84.6% | 53.8% |
| Range | 67.5% | 49.6% |
| Mean | 56.9% | 19.4% |
| Median | 57.3% | 17.6% |
| Interquartile 25% (IQ1) | 47.9% | 13.0% |
| Interquartile 75% (IQ3) | 67.3% | 23.6% |
| Interquartile Range (IQR) | 19.3% | 10.6% |
| Standard Deviation (Sample) | 13.2% | 8.9% |
| Standard Deviation (Population) | 13.1% | 8.8% |
Similar Demographics by Bachelor's Degree
Demographics Similar to Immigrants from Iran by Bachelor's Degree
In terms of bachelor's degree, the demographic groups most similar to Immigrants from Iran are Thai (50.1%, a difference of 0.37%), Okinawan (50.5%, a difference of 0.48%), Immigrants from Israel (50.0%, a difference of 0.61%), Iranian (51.0%, a difference of 1.3%), and Immigrants from Taiwan (51.2%, a difference of 1.7%).
| Demographics | Rating | Rank | Bachelor's Degree |
| Filipinos | 100.0 /100 | #1 | Exceptional 52.7% |
| Immigrants | Singapore | 100.0 /100 | #2 | Exceptional 51.9% |
| Immigrants | India | 100.0 /100 | #3 | Exceptional 51.3% |
| Immigrants | Taiwan | 100.0 /100 | #4 | Exceptional 51.2% |
| Iranians | 100.0 /100 | #5 | Exceptional 51.0% |
| Okinawans | 100.0 /100 | #6 | Exceptional 50.5% |
| Immigrants | Iran | 100.0 /100 | #7 | Exceptional 50.3% |
| Thais | 100.0 /100 | #8 | Exceptional 50.1% |
| Immigrants | Israel | 100.0 /100 | #9 | Exceptional 50.0% |
| Cypriots | 100.0 /100 | #10 | Exceptional 49.0% |
| Immigrants | Australia | 100.0 /100 | #11 | Exceptional 48.5% |
| Immigrants | China | 100.0 /100 | #12 | Exceptional 48.4% |
| Immigrants | South Central Asia | 100.0 /100 | #13 | Exceptional 48.3% |
| Immigrants | Hong Kong | 100.0 /100 | #14 | Exceptional 48.2% |
| Immigrants | Eastern Asia | 100.0 /100 | #15 | Exceptional 48.1% |
Demographics Similar to Cherokee by Bachelor's Degree
In terms of bachelor's degree, the demographic groups most similar to Cherokee are Bangladeshi (30.2%, a difference of 0.010%), Mexican American Indian (30.2%, a difference of 0.17%), Immigrants from Latin America (30.1%, a difference of 0.42%), Immigrants from Cuba (30.3%, a difference of 0.45%), and Immigrants from Micronesia (30.4%, a difference of 0.67%).
| Demographics | Rating | Rank | Bachelor's Degree |
| Immigrants | Haiti | 0.0 /100 | #297 | Tragic 30.6% |
| Chippewa | 0.0 /100 | #298 | Tragic 30.6% |
| Chickasaw | 0.0 /100 | #299 | Tragic 30.4% |
| Immigrants | Micronesia | 0.0 /100 | #300 | Tragic 30.4% |
| Immigrants | Cuba | 0.0 /100 | #301 | Tragic 30.3% |
| Mexican American Indians | 0.0 /100 | #302 | Tragic 30.2% |
| Bangladeshis | 0.0 /100 | #303 | Tragic 30.2% |
| Cherokee | 0.0 /100 | #304 | Tragic 30.2% |
| Immigrants | Latin America | 0.0 /100 | #305 | Tragic 30.1% |
| Immigrants | Yemen | 0.0 /100 | #306 | Tragic 29.9% |
| Nepalese | 0.0 /100 | #307 | Tragic 29.9% |
| Cajuns | 0.0 /100 | #308 | Tragic 29.6% |
| Hispanics or Latinos | 0.0 /100 | #309 | Tragic 29.6% |
| Cheyenne | 0.0 /100 | #310 | Tragic 29.4% |
| Choctaw | 0.0 /100 | #311 | Tragic 29.4% |