Immigrants from Iran vs Ecuadorian Bachelor's Degree
COMPARE
Immigrants from Iran
Ecuadorian
Bachelor's Degree
Bachelor's Degree Comparison
Immigrants from Iran
Ecuadorians
50.3%
BACHELOR'S DEGREE
100.0/ 100
METRIC RATING
7th/ 347
METRIC RANK
35.4%
BACHELOR'S DEGREE
6.6/ 100
METRIC RATING
227th/ 347
METRIC RANK
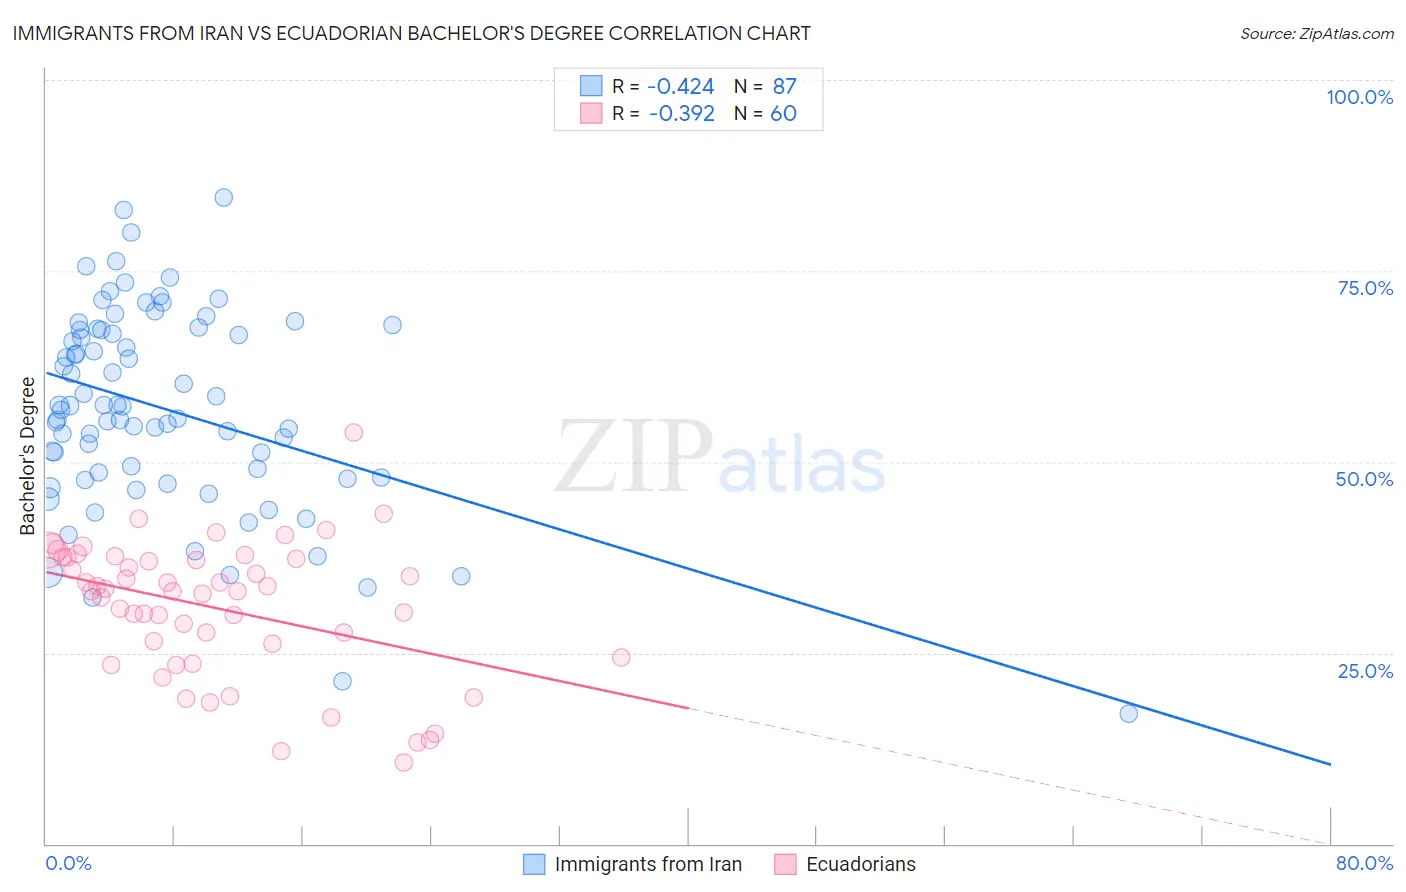
Immigrants from Iran vs Ecuadorian Bachelor's Degree Correlation Chart
The statistical analysis conducted on geographies consisting of 279,901,674 people shows a moderate negative correlation between the proportion of Immigrants from Iran and percentage of population with at least bachelor's degree education in the United States with a correlation coefficient (R) of -0.424 and weighted average of 50.3%. Similarly, the statistical analysis conducted on geographies consisting of 317,830,457 people shows a mild negative correlation between the proportion of Ecuadorians and percentage of population with at least bachelor's degree education in the United States with a correlation coefficient (R) of -0.392 and weighted average of 35.4%, a difference of 42.2%.
Bachelor's Degree Correlation Summary
| Measurement | Immigrants from Iran | Ecuadorian |
| Minimum | 17.0% | 10.6% |
| Maximum | 84.6% | 53.9% |
| Range | 67.5% | 43.3% |
| Mean | 56.9% | 30.9% |
| Median | 57.3% | 33.1% |
| Interquartile 25% (IQ1) | 47.9% | 25.3% |
| Interquartile 75% (IQ3) | 67.3% | 37.4% |
| Interquartile Range (IQR) | 19.3% | 12.1% |
| Standard Deviation (Sample) | 13.2% | 8.9% |
| Standard Deviation (Population) | 13.1% | 8.8% |
Similar Demographics by Bachelor's Degree
Demographics Similar to Immigrants from Iran by Bachelor's Degree
In terms of bachelor's degree, the demographic groups most similar to Immigrants from Iran are Thai (50.1%, a difference of 0.37%), Okinawan (50.5%, a difference of 0.48%), Immigrants from Israel (50.0%, a difference of 0.61%), Iranian (51.0%, a difference of 1.3%), and Immigrants from Taiwan (51.2%, a difference of 1.7%).
| Demographics | Rating | Rank | Bachelor's Degree |
| Filipinos | 100.0 /100 | #1 | Exceptional 52.7% |
| Immigrants | Singapore | 100.0 /100 | #2 | Exceptional 51.9% |
| Immigrants | India | 100.0 /100 | #3 | Exceptional 51.3% |
| Immigrants | Taiwan | 100.0 /100 | #4 | Exceptional 51.2% |
| Iranians | 100.0 /100 | #5 | Exceptional 51.0% |
| Okinawans | 100.0 /100 | #6 | Exceptional 50.5% |
| Immigrants | Iran | 100.0 /100 | #7 | Exceptional 50.3% |
| Thais | 100.0 /100 | #8 | Exceptional 50.1% |
| Immigrants | Israel | 100.0 /100 | #9 | Exceptional 50.0% |
| Cypriots | 100.0 /100 | #10 | Exceptional 49.0% |
| Immigrants | Australia | 100.0 /100 | #11 | Exceptional 48.5% |
| Immigrants | China | 100.0 /100 | #12 | Exceptional 48.4% |
| Immigrants | South Central Asia | 100.0 /100 | #13 | Exceptional 48.3% |
| Immigrants | Hong Kong | 100.0 /100 | #14 | Exceptional 48.2% |
| Immigrants | Eastern Asia | 100.0 /100 | #15 | Exceptional 48.1% |
Demographics Similar to Ecuadorians by Bachelor's Degree
In terms of bachelor's degree, the demographic groups most similar to Ecuadorians are Immigrants from Trinidad and Tobago (35.3%, a difference of 0.23%), Portuguese (35.5%, a difference of 0.26%), Immigrants from Burma/Myanmar (35.5%, a difference of 0.30%), White/Caucasian (35.3%, a difference of 0.31%), and Immigrants from Barbados (35.5%, a difference of 0.37%).
| Demographics | Rating | Rank | Bachelor's Degree |
| Spanish | 9.6 /100 | #220 | Tragic 35.8% |
| Dutch | 9.2 /100 | #221 | Tragic 35.7% |
| Trinidadians and Tobagonians | 8.8 /100 | #222 | Tragic 35.7% |
| French Canadians | 8.3 /100 | #223 | Tragic 35.6% |
| Immigrants | Barbados | 7.5 /100 | #224 | Tragic 35.5% |
| Immigrants | Burma/Myanmar | 7.3 /100 | #225 | Tragic 35.5% |
| Portuguese | 7.2 /100 | #226 | Tragic 35.5% |
| Ecuadorians | 6.6 /100 | #227 | Tragic 35.4% |
| Immigrants | Trinidad and Tobago | 6.0 /100 | #228 | Tragic 35.3% |
| Whites/Caucasians | 5.9 /100 | #229 | Tragic 35.3% |
| Immigrants | Grenada | 4.3 /100 | #230 | Tragic 35.0% |
| Immigrants | St. Vincent and the Grenadines | 4.3 /100 | #231 | Tragic 35.0% |
| Hmong | 3.4 /100 | #232 | Tragic 34.8% |
| Immigrants | Ecuador | 3.3 /100 | #233 | Tragic 34.7% |
| Guamanians/Chamorros | 3.0 /100 | #234 | Tragic 34.6% |