Immigrants from Australia vs Ute Doctorate Degree
COMPARE
Immigrants from Australia
Ute
Doctorate Degree
Doctorate Degree Comparison
Immigrants from Australia
Ute
2.8%
DOCTORATE DEGREE
100.0/ 100
METRIC RATING
17th/ 347
METRIC RANK
2.0%
DOCTORATE DEGREE
93.2/ 100
METRIC RATING
124th/ 347
METRIC RANK
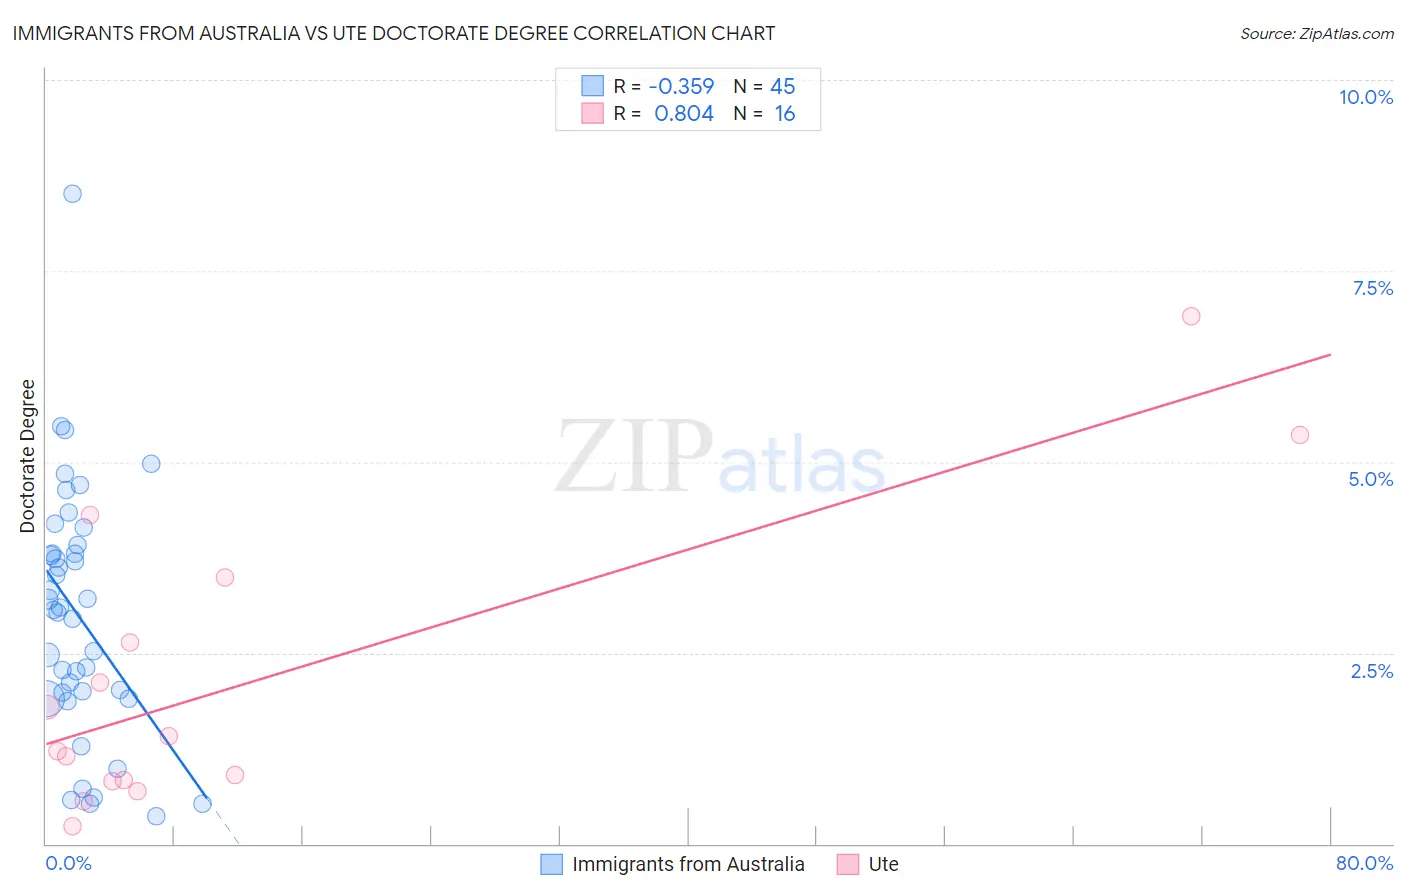
Immigrants from Australia vs Ute Doctorate Degree Correlation Chart
The statistical analysis conducted on geographies consisting of 226,352,894 people shows a mild negative correlation between the proportion of Immigrants from Australia and percentage of population with at least doctorate degree education in the United States with a correlation coefficient (R) of -0.359 and weighted average of 2.8%. Similarly, the statistical analysis conducted on geographies consisting of 55,479,547 people shows a very strong positive correlation between the proportion of Ute and percentage of population with at least doctorate degree education in the United States with a correlation coefficient (R) of 0.804 and weighted average of 2.0%, a difference of 39.0%.
Doctorate Degree Correlation Summary
| Measurement | Immigrants from Australia | Ute |
| Minimum | 0.36% | 0.23% |
| Maximum | 8.5% | 6.9% |
| Range | 8.2% | 6.7% |
| Mean | 3.0% | 2.1% |
| Median | 3.1% | 1.3% |
| Interquartile 25% (IQ1) | 1.9% | 0.83% |
| Interquartile 75% (IQ3) | 3.9% | 3.1% |
| Interquartile Range (IQR) | 1.9% | 2.2% |
| Standard Deviation (Sample) | 1.6% | 1.9% |
| Standard Deviation (Population) | 1.6% | 1.9% |
Similar Demographics by Doctorate Degree
Demographics Similar to Immigrants from Australia by Doctorate Degree
In terms of doctorate degree, the demographic groups most similar to Immigrants from Australia are Immigrants from Sri Lanka (2.8%, a difference of 0.24%), Immigrants from Japan (2.8%, a difference of 0.62%), Eastern European (2.8%, a difference of 0.70%), Immigrants from Hong Kong (2.8%, a difference of 0.97%), and Immigrants from India (2.8%, a difference of 1.0%).
| Demographics | Rating | Rank | Doctorate Degree |
| Immigrants | Eastern Asia | 100.0 /100 | #10 | Exceptional 3.0% |
| Indians (Asian) | 100.0 /100 | #11 | Exceptional 2.9% |
| Immigrants | Belgium | 100.0 /100 | #12 | Exceptional 2.9% |
| Immigrants | Sweden | 100.0 /100 | #13 | Exceptional 2.9% |
| Immigrants | France | 100.0 /100 | #14 | Exceptional 2.9% |
| Immigrants | India | 100.0 /100 | #15 | Exceptional 2.8% |
| Eastern Europeans | 100.0 /100 | #16 | Exceptional 2.8% |
| Immigrants | Australia | 100.0 /100 | #17 | Exceptional 2.8% |
| Immigrants | Sri Lanka | 100.0 /100 | #18 | Exceptional 2.8% |
| Immigrants | Japan | 100.0 /100 | #19 | Exceptional 2.8% |
| Immigrants | Hong Kong | 100.0 /100 | #20 | Exceptional 2.8% |
| Thais | 100.0 /100 | #21 | Exceptional 2.8% |
| Mongolians | 100.0 /100 | #22 | Exceptional 2.8% |
| Immigrants | Denmark | 100.0 /100 | #23 | Exceptional 2.8% |
| Israelis | 100.0 /100 | #24 | Exceptional 2.7% |
Demographics Similar to Ute by Doctorate Degree
In terms of doctorate degree, the demographic groups most similar to Ute are Moroccan (2.0%, a difference of 0.11%), Croatian (2.0%, a difference of 0.47%), Jordanian (2.0%, a difference of 0.52%), Palestinian (2.0%, a difference of 0.56%), and Immigrants from Southern Europe (2.0%, a difference of 0.93%).
| Demographics | Rating | Rank | Doctorate Degree |
| Lebanese | 96.0 /100 | #117 | Exceptional 2.1% |
| Icelanders | 96.0 /100 | #118 | Exceptional 2.1% |
| Pakistanis | 95.8 /100 | #119 | Exceptional 2.0% |
| Immigrants | Morocco | 95.5 /100 | #120 | Exceptional 2.0% |
| Immigrants | Jordan | 94.8 /100 | #121 | Exceptional 2.0% |
| Immigrants | Southern Europe | 94.7 /100 | #122 | Exceptional 2.0% |
| Croatians | 94.0 /100 | #123 | Exceptional 2.0% |
| Ute | 93.2 /100 | #124 | Exceptional 2.0% |
| Moroccans | 93.0 /100 | #125 | Exceptional 2.0% |
| Jordanians | 92.1 /100 | #126 | Exceptional 2.0% |
| Palestinians | 92.0 /100 | #127 | Exceptional 2.0% |
| Immigrants | Zaire | 91.1 /100 | #128 | Exceptional 2.0% |
| Canadians | 90.6 /100 | #129 | Exceptional 2.0% |
| Immigrants | Ukraine | 90.5 /100 | #130 | Exceptional 2.0% |
| Immigrants | Sierra Leone | 90.2 /100 | #131 | Exceptional 2.0% |