Immigrants from Indonesia vs Immigrants from Fiji 2nd Grade
COMPARE
Immigrants from Indonesia
Immigrants from Fiji
2nd Grade
2nd Grade Comparison
Immigrants from Indonesia
Immigrants from Fiji
97.5%
2ND GRADE
1.2/ 100
METRIC RATING
242nd/ 347
METRIC RANK
96.4%
2ND GRADE
0.0/ 100
METRIC RATING
336th/ 347
METRIC RANK
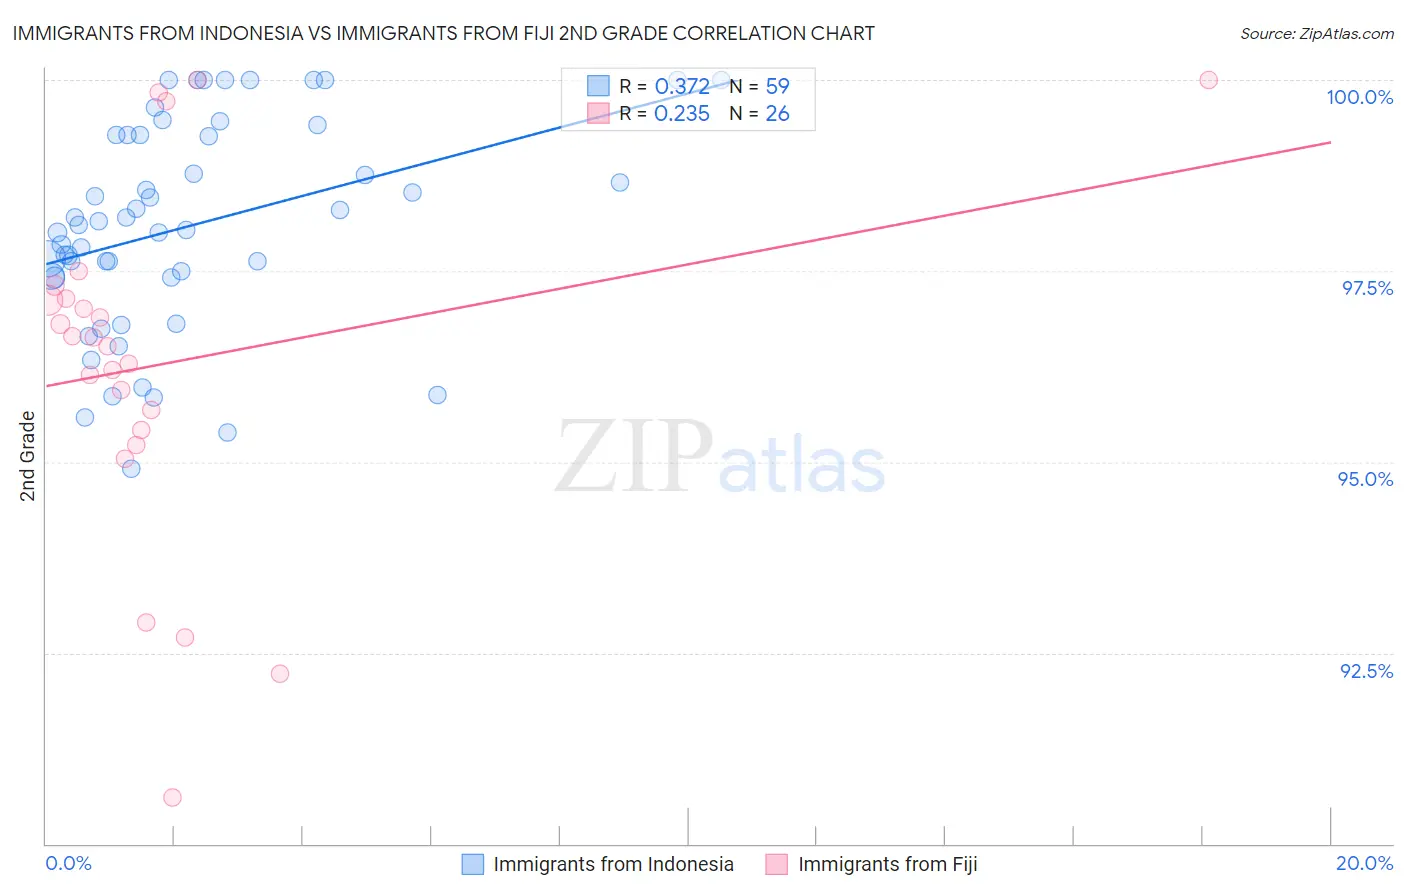
Immigrants from Indonesia vs Immigrants from Fiji 2nd Grade Correlation Chart
The statistical analysis conducted on geographies consisting of 215,782,971 people shows a mild positive correlation between the proportion of Immigrants from Indonesia and percentage of population with at least 2nd grade education in the United States with a correlation coefficient (R) of 0.372 and weighted average of 97.5%. Similarly, the statistical analysis conducted on geographies consisting of 93,756,204 people shows a weak positive correlation between the proportion of Immigrants from Fiji and percentage of population with at least 2nd grade education in the United States with a correlation coefficient (R) of 0.235 and weighted average of 96.4%, a difference of 1.2%.
2nd Grade Correlation Summary
| Measurement | Immigrants from Indonesia | Immigrants from Fiji |
| Minimum | 94.9% | 90.6% |
| Maximum | 100.0% | 100.0% |
| Range | 5.1% | 9.4% |
| Mean | 98.1% | 96.3% |
| Median | 98.1% | 96.6% |
| Interquartile 25% (IQ1) | 97.4% | 95.4% |
| Interquartile 75% (IQ3) | 99.3% | 97.1% |
| Interquartile Range (IQR) | 1.9% | 1.7% |
| Standard Deviation (Sample) | 1.4% | 2.3% |
| Standard Deviation (Population) | 1.3% | 2.3% |
Similar Demographics by 2nd Grade
Demographics Similar to Immigrants from Indonesia by 2nd Grade
In terms of 2nd grade, the demographic groups most similar to Immigrants from Indonesia are Ethiopian (97.5%, a difference of 0.0%), Korean (97.5%, a difference of 0.010%), Asian (97.5%, a difference of 0.010%), Nigerian (97.6%, a difference of 0.020%), and U.S. Virgin Islander (97.6%, a difference of 0.020%).
| Demographics | Rating | Rank | 2nd Grade |
| Colombians | 1.9 /100 | #235 | Tragic 97.6% |
| Nigerians | 1.7 /100 | #236 | Tragic 97.6% |
| U.S. Virgin Islanders | 1.6 /100 | #237 | Tragic 97.6% |
| Immigrants | Eastern Asia | 1.6 /100 | #238 | Tragic 97.6% |
| Liberians | 1.6 /100 | #239 | Tragic 97.6% |
| Koreans | 1.5 /100 | #240 | Tragic 97.5% |
| Ethiopians | 1.2 /100 | #241 | Tragic 97.5% |
| Immigrants | Indonesia | 1.2 /100 | #242 | Tragic 97.5% |
| Asians | 1.1 /100 | #243 | Tragic 97.5% |
| Immigrants | Iraq | 1.0 /100 | #244 | Tragic 97.5% |
| Immigrants | Eastern Africa | 0.9 /100 | #245 | Tragic 97.5% |
| South Americans | 0.9 /100 | #246 | Tragic 97.5% |
| Immigrants | Senegal | 0.9 /100 | #247 | Tragic 97.5% |
| Immigrants | Middle Africa | 0.9 /100 | #248 | Tragic 97.5% |
| Bolivians | 0.9 /100 | #249 | Tragic 97.5% |
Demographics Similar to Immigrants from Fiji by 2nd Grade
In terms of 2nd grade, the demographic groups most similar to Immigrants from Fiji are Yakama (96.4%, a difference of 0.010%), Immigrants from Cambodia (96.4%, a difference of 0.010%), Central American (96.4%, a difference of 0.020%), Immigrants from Cabo Verde (96.3%, a difference of 0.030%), and Immigrants from Dominican Republic (96.4%, a difference of 0.040%).
| Demographics | Rating | Rank | 2nd Grade |
| Japanese | 0.0 /100 | #329 | Tragic 96.5% |
| Immigrants | Latin America | 0.0 /100 | #330 | Tragic 96.5% |
| Immigrants | Armenia | 0.0 /100 | #331 | Tragic 96.5% |
| Bangladeshis | 0.0 /100 | #332 | Tragic 96.5% |
| Immigrants | Dominican Republic | 0.0 /100 | #333 | Tragic 96.4% |
| Central Americans | 0.0 /100 | #334 | Tragic 96.4% |
| Yakama | 0.0 /100 | #335 | Tragic 96.4% |
| Immigrants | Fiji | 0.0 /100 | #336 | Tragic 96.4% |
| Immigrants | Cambodia | 0.0 /100 | #337 | Tragic 96.4% |
| Immigrants | Cabo Verde | 0.0 /100 | #338 | Tragic 96.3% |
| Guatemalans | 0.0 /100 | #339 | Tragic 96.3% |
| Immigrants | Guatemala | 0.0 /100 | #340 | Tragic 96.2% |
| Immigrants | Central America | 0.0 /100 | #341 | Tragic 96.2% |
| Immigrants | Mexico | 0.0 /100 | #342 | Tragic 96.1% |
| Nepalese | 0.0 /100 | #343 | Tragic 96.1% |