Immigrants from Singapore vs Ukrainian 2nd Grade
COMPARE
Immigrants from Singapore
Ukrainian
2nd Grade
2nd Grade Comparison
Immigrants from Singapore
Ukrainians
98.1%
2ND GRADE
97.0/ 100
METRIC RATING
110th/ 347
METRIC RANK
98.2%
2ND GRADE
98.9/ 100
METRIC RATING
89th/ 347
METRIC RANK
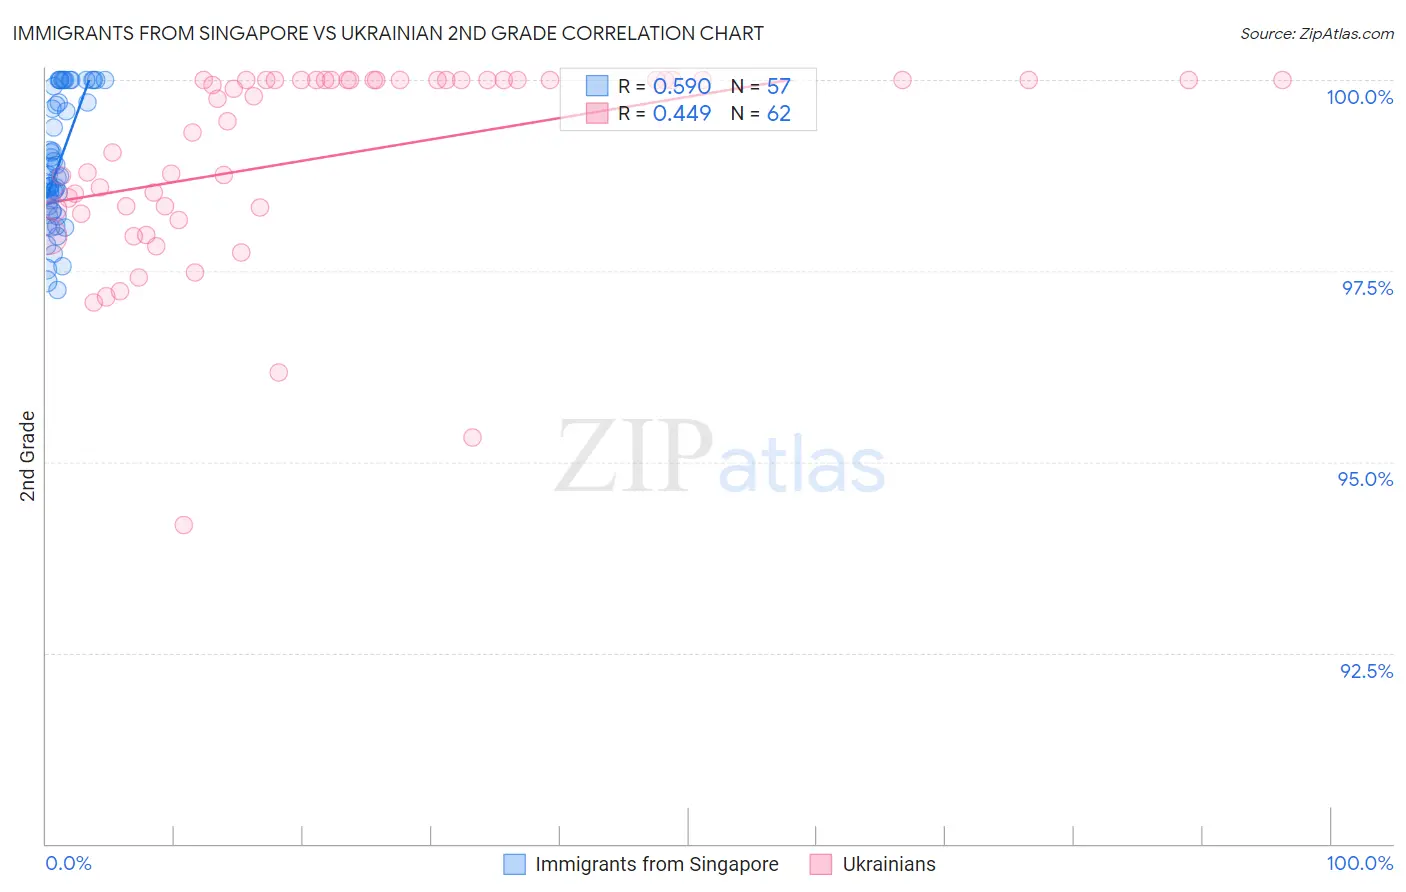
Immigrants from Singapore vs Ukrainian 2nd Grade Correlation Chart
The statistical analysis conducted on geographies consisting of 137,521,700 people shows a substantial positive correlation between the proportion of Immigrants from Singapore and percentage of population with at least 2nd grade education in the United States with a correlation coefficient (R) of 0.590 and weighted average of 98.1%. Similarly, the statistical analysis conducted on geographies consisting of 448,698,169 people shows a moderate positive correlation between the proportion of Ukrainians and percentage of population with at least 2nd grade education in the United States with a correlation coefficient (R) of 0.449 and weighted average of 98.2%, a difference of 0.080%.
2nd Grade Correlation Summary
| Measurement | Immigrants from Singapore | Ukrainian |
| Minimum | 97.2% | 94.2% |
| Maximum | 100.0% | 100.0% |
| Range | 2.8% | 5.8% |
| Mean | 98.9% | 99.0% |
| Median | 98.7% | 99.8% |
| Interquartile 25% (IQ1) | 98.3% | 98.3% |
| Interquartile 75% (IQ3) | 99.8% | 100.0% |
| Interquartile Range (IQR) | 1.5% | 1.7% |
| Standard Deviation (Sample) | 0.83% | 1.3% |
| Standard Deviation (Population) | 0.82% | 1.3% |
Similar Demographics by 2nd Grade
Demographics Similar to Immigrants from Singapore by 2nd Grade
In terms of 2nd grade, the demographic groups most similar to Immigrants from Singapore are Immigrants from Czechoslovakia (98.1%, a difference of 0.0%), Bhutanese (98.1%, a difference of 0.010%), German Russian (98.1%, a difference of 0.010%), Immigrants from Switzerland (98.1%, a difference of 0.010%), and Basque (98.1%, a difference of 0.010%).
| Demographics | Rating | Rank | 2nd Grade |
| Pima | 97.6 /100 | #103 | Exceptional 98.2% |
| Turks | 97.6 /100 | #104 | Exceptional 98.2% |
| Yugoslavians | 97.5 /100 | #105 | Exceptional 98.2% |
| Bhutanese | 97.5 /100 | #106 | Exceptional 98.1% |
| German Russians | 97.4 /100 | #107 | Exceptional 98.1% |
| Immigrants | Switzerland | 97.3 /100 | #108 | Exceptional 98.1% |
| Basques | 97.2 /100 | #109 | Exceptional 98.1% |
| Immigrants | Singapore | 97.0 /100 | #110 | Exceptional 98.1% |
| Immigrants | Czechoslovakia | 96.9 /100 | #111 | Exceptional 98.1% |
| Colville | 96.6 /100 | #112 | Exceptional 98.1% |
| Immigrants | Norway | 96.5 /100 | #113 | Exceptional 98.1% |
| Immigrants | Latvia | 96.4 /100 | #114 | Exceptional 98.1% |
| Iranians | 95.9 /100 | #115 | Exceptional 98.1% |
| Spanish | 95.8 /100 | #116 | Exceptional 98.1% |
| Ute | 95.7 /100 | #117 | Exceptional 98.1% |
Demographics Similar to Ukrainians by 2nd Grade
In terms of 2nd grade, the demographic groups most similar to Ukrainians are Macedonian (98.2%, a difference of 0.0%), Delaware (98.2%, a difference of 0.010%), Immigrants from Sweden (98.2%, a difference of 0.010%), Hopi (98.2%, a difference of 0.010%), and Potawatomi (98.2%, a difference of 0.010%).
| Demographics | Rating | Rank | 2nd Grade |
| Delaware | 99.1 /100 | #82 | Exceptional 98.2% |
| Immigrants | Sweden | 99.1 /100 | #83 | Exceptional 98.2% |
| Hopi | 99.1 /100 | #84 | Exceptional 98.2% |
| Potawatomi | 99.1 /100 | #85 | Exceptional 98.2% |
| Immigrants | Australia | 99.0 /100 | #86 | Exceptional 98.2% |
| Immigrants | Denmark | 99.0 /100 | #87 | Exceptional 98.2% |
| Macedonians | 99.0 /100 | #88 | Exceptional 98.2% |
| Ukrainians | 98.9 /100 | #89 | Exceptional 98.2% |
| Zimbabweans | 98.8 /100 | #90 | Exceptional 98.2% |
| Immigrants | Western Europe | 98.8 /100 | #91 | Exceptional 98.2% |
| Immigrants | South Africa | 98.8 /100 | #92 | Exceptional 98.2% |
| Immigrants | India | 98.8 /100 | #93 | Exceptional 98.2% |
| Immigrants | Germany | 98.6 /100 | #94 | Exceptional 98.2% |
| South Africans | 98.6 /100 | #95 | Exceptional 98.2% |
| Cypriots | 98.4 /100 | #96 | Exceptional 98.2% |