Immigrants from Kuwait vs Scandinavian 7th Grade
COMPARE
Immigrants from Kuwait
Scandinavian
7th Grade
7th Grade Comparison
Immigrants from Kuwait
Scandinavians
96.4%
7TH GRADE
91.1/ 100
METRIC RATING
135th/ 347
METRIC RANK
97.4%
7TH GRADE
100.0/ 100
METRIC RATING
29th/ 347
METRIC RANK
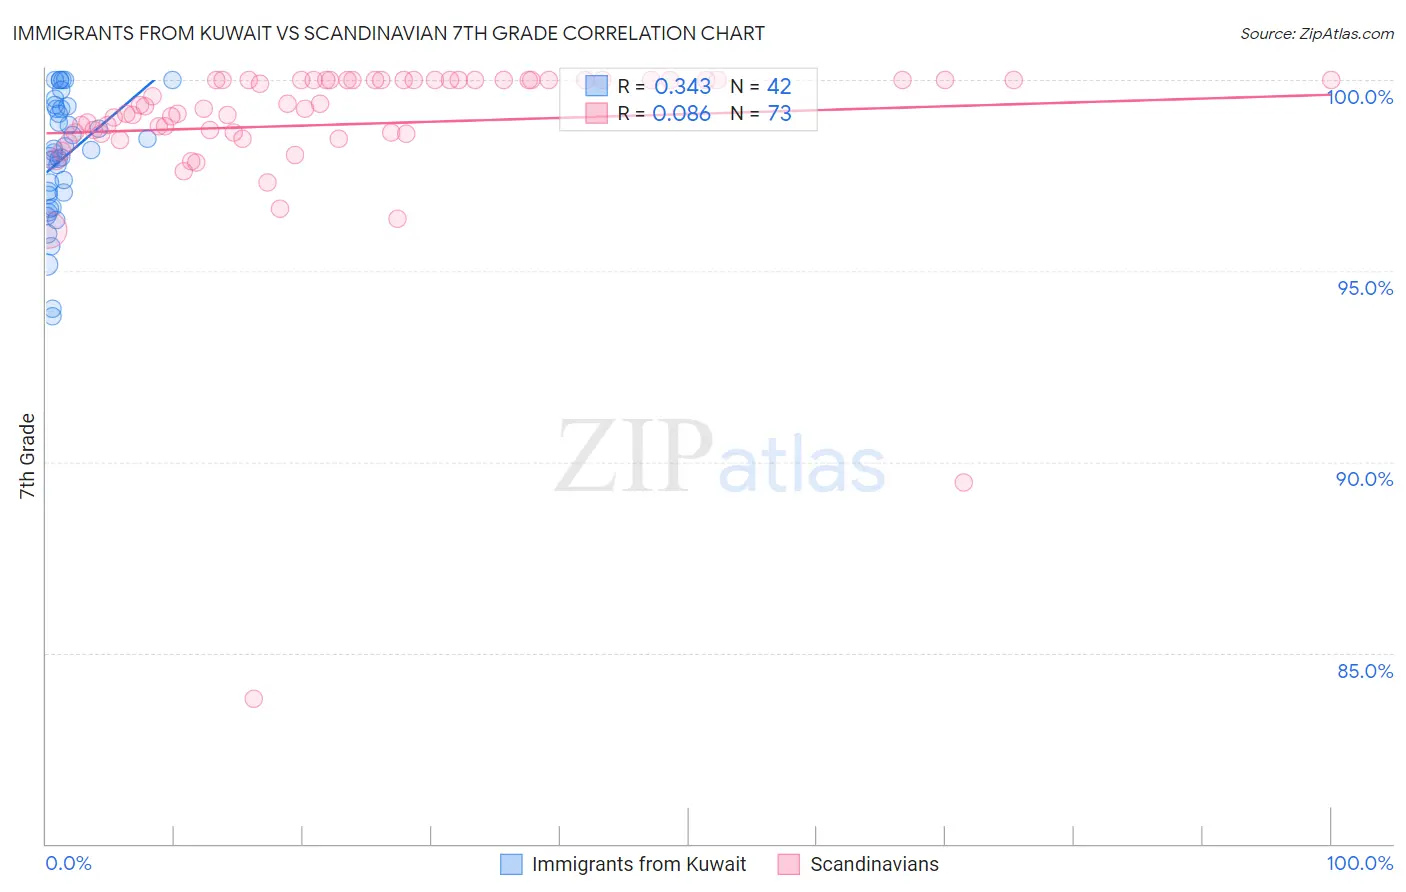
Immigrants from Kuwait vs Scandinavian 7th Grade Correlation Chart
The statistical analysis conducted on geographies consisting of 136,913,666 people shows a mild positive correlation between the proportion of Immigrants from Kuwait and percentage of population with at least 7th grade education in the United States with a correlation coefficient (R) of 0.343 and weighted average of 96.4%. Similarly, the statistical analysis conducted on geographies consisting of 472,660,435 people shows a slight positive correlation between the proportion of Scandinavians and percentage of population with at least 7th grade education in the United States with a correlation coefficient (R) of 0.086 and weighted average of 97.4%, a difference of 1.0%.
7th Grade Correlation Summary
| Measurement | Immigrants from Kuwait | Scandinavian |
| Minimum | 93.8% | 83.8% |
| Maximum | 100.0% | 100.0% |
| Range | 6.2% | 16.2% |
| Mean | 98.0% | 98.8% |
| Median | 98.1% | 99.3% |
| Interquartile 25% (IQ1) | 97.0% | 98.6% |
| Interquartile 75% (IQ3) | 99.2% | 100.0% |
| Interquartile Range (IQR) | 2.2% | 1.4% |
| Standard Deviation (Sample) | 1.6% | 2.3% |
| Standard Deviation (Population) | 1.6% | 2.3% |
Similar Demographics by 7th Grade
Demographics Similar to Immigrants from Kuwait by 7th Grade
In terms of 7th grade, the demographic groups most similar to Immigrants from Kuwait are Soviet Union (96.4%, a difference of 0.0%), Colville (96.4%, a difference of 0.010%), Hmong (96.4%, a difference of 0.010%), Immigrants from Hungary (96.4%, a difference of 0.010%), and Filipino (96.4%, a difference of 0.020%).
| Demographics | Rating | Rank | 7th Grade |
| Immigrants | Romania | 93.2 /100 | #128 | Exceptional 96.4% |
| Immigrants | North Macedonia | 93.1 /100 | #129 | Exceptional 96.4% |
| Immigrants | Serbia | 92.8 /100 | #130 | Exceptional 96.4% |
| Filipinos | 92.1 /100 | #131 | Exceptional 96.4% |
| Colville | 91.7 /100 | #132 | Exceptional 96.4% |
| Hmong | 91.5 /100 | #133 | Exceptional 96.4% |
| Soviet Union | 91.2 /100 | #134 | Exceptional 96.4% |
| Immigrants | Kuwait | 91.1 /100 | #135 | Exceptional 96.4% |
| Immigrants | Hungary | 90.6 /100 | #136 | Exceptional 96.4% |
| Immigrants | Turkey | 90.2 /100 | #137 | Exceptional 96.4% |
| Jordanians | 90.0 /100 | #138 | Excellent 96.4% |
| Basques | 89.3 /100 | #139 | Excellent 96.4% |
| Cambodians | 88.3 /100 | #140 | Excellent 96.3% |
| Immigrants | South Central Asia | 87.1 /100 | #141 | Excellent 96.3% |
| Burmese | 87.1 /100 | #142 | Excellent 96.3% |
Demographics Similar to Scandinavians by 7th Grade
In terms of 7th grade, the demographic groups most similar to Scandinavians are Sioux (97.4%, a difference of 0.0%), Czech (97.4%, a difference of 0.010%), French (97.4%, a difference of 0.030%), Scotch-Irish (97.4%, a difference of 0.030%), and Danish (97.4%, a difference of 0.030%).
| Demographics | Rating | Rank | 7th Grade |
| French Canadians | 100.0 /100 | #22 | Exceptional 97.4% |
| Croatians | 100.0 /100 | #23 | Exceptional 97.4% |
| Welsh | 100.0 /100 | #24 | Exceptional 97.4% |
| French | 100.0 /100 | #25 | Exceptional 97.4% |
| Scotch-Irish | 100.0 /100 | #26 | Exceptional 97.4% |
| Danes | 100.0 /100 | #27 | Exceptional 97.4% |
| Sioux | 100.0 /100 | #28 | Exceptional 97.4% |
| Scandinavians | 100.0 /100 | #29 | Exceptional 97.4% |
| Czechs | 100.0 /100 | #30 | Exceptional 97.4% |
| Europeans | 100.0 /100 | #31 | Exceptional 97.3% |
| Italians | 100.0 /100 | #32 | Exceptional 97.3% |
| Chippewa | 100.0 /100 | #33 | Exceptional 97.3% |
| Alaska Natives | 100.0 /100 | #34 | Exceptional 97.3% |
| Swiss | 100.0 /100 | #35 | Exceptional 97.3% |
| Hungarians | 100.0 /100 | #36 | Exceptional 97.2% |