French vs Immigrants from Fiji 2nd Grade
COMPARE
French
Immigrants from Fiji
2nd Grade
2nd Grade Comparison
French
Immigrants from Fiji
98.5%
2ND GRADE
100.0/ 100
METRIC RATING
29th/ 347
METRIC RANK
96.4%
2ND GRADE
0.0/ 100
METRIC RATING
336th/ 347
METRIC RANK
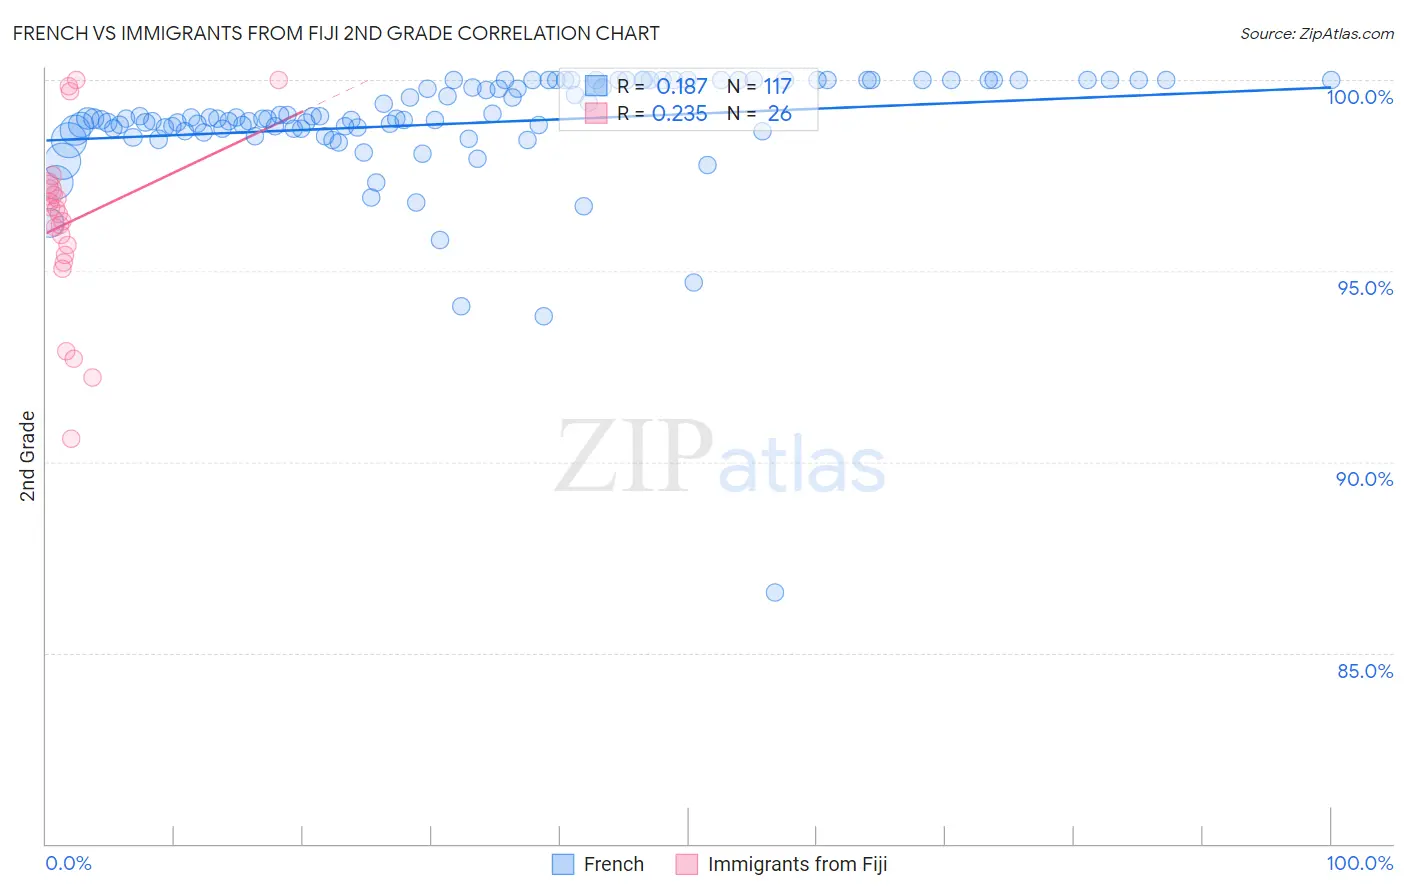
French vs Immigrants from Fiji 2nd Grade Correlation Chart
The statistical analysis conducted on geographies consisting of 572,427,269 people shows a poor positive correlation between the proportion of French and percentage of population with at least 2nd grade education in the United States with a correlation coefficient (R) of 0.187 and weighted average of 98.5%. Similarly, the statistical analysis conducted on geographies consisting of 93,756,204 people shows a weak positive correlation between the proportion of Immigrants from Fiji and percentage of population with at least 2nd grade education in the United States with a correlation coefficient (R) of 0.235 and weighted average of 96.4%, a difference of 2.2%.
2nd Grade Correlation Summary
| Measurement | French | Immigrants from Fiji |
| Minimum | 86.6% | 90.6% |
| Maximum | 100.0% | 100.0% |
| Range | 13.4% | 9.4% |
| Mean | 98.9% | 96.3% |
| Median | 99.0% | 96.6% |
| Interquartile 25% (IQ1) | 98.7% | 95.4% |
| Interquartile 75% (IQ3) | 100.0% | 97.1% |
| Interquartile Range (IQR) | 1.3% | 1.7% |
| Standard Deviation (Sample) | 1.6% | 2.3% |
| Standard Deviation (Population) | 1.6% | 2.3% |
Similar Demographics by 2nd Grade
Demographics Similar to French by 2nd Grade
In terms of 2nd grade, the demographic groups most similar to French are Arapaho (98.5%, a difference of 0.0%), Welsh (98.5%, a difference of 0.010%), Croatian (98.5%, a difference of 0.010%), European (98.5%, a difference of 0.010%), and Czech (98.5%, a difference of 0.010%).
| Demographics | Rating | Rank | 2nd Grade |
| Poles | 100.0 /100 | #22 | Exceptional 98.5% |
| Danes | 100.0 /100 | #23 | Exceptional 98.5% |
| Pennsylvania Germans | 100.0 /100 | #24 | Exceptional 98.5% |
| Scotch-Irish | 100.0 /100 | #25 | Exceptional 98.5% |
| Welsh | 100.0 /100 | #26 | Exceptional 98.5% |
| Croatians | 100.0 /100 | #27 | Exceptional 98.5% |
| Arapaho | 100.0 /100 | #28 | Exceptional 98.5% |
| French | 100.0 /100 | #29 | Exceptional 98.5% |
| Europeans | 100.0 /100 | #30 | Exceptional 98.5% |
| Czechs | 100.0 /100 | #31 | Exceptional 98.5% |
| French Canadians | 100.0 /100 | #32 | Exceptional 98.5% |
| Scandinavians | 100.0 /100 | #33 | Exceptional 98.5% |
| Chinese | 100.0 /100 | #34 | Exceptional 98.5% |
| Swiss | 100.0 /100 | #35 | Exceptional 98.5% |
| British | 100.0 /100 | #36 | Exceptional 98.5% |
Demographics Similar to Immigrants from Fiji by 2nd Grade
In terms of 2nd grade, the demographic groups most similar to Immigrants from Fiji are Yakama (96.4%, a difference of 0.010%), Immigrants from Cambodia (96.4%, a difference of 0.010%), Central American (96.4%, a difference of 0.020%), Immigrants from Cabo Verde (96.3%, a difference of 0.030%), and Immigrants from Dominican Republic (96.4%, a difference of 0.040%).
| Demographics | Rating | Rank | 2nd Grade |
| Japanese | 0.0 /100 | #329 | Tragic 96.5% |
| Immigrants | Latin America | 0.0 /100 | #330 | Tragic 96.5% |
| Immigrants | Armenia | 0.0 /100 | #331 | Tragic 96.5% |
| Bangladeshis | 0.0 /100 | #332 | Tragic 96.5% |
| Immigrants | Dominican Republic | 0.0 /100 | #333 | Tragic 96.4% |
| Central Americans | 0.0 /100 | #334 | Tragic 96.4% |
| Yakama | 0.0 /100 | #335 | Tragic 96.4% |
| Immigrants | Fiji | 0.0 /100 | #336 | Tragic 96.4% |
| Immigrants | Cambodia | 0.0 /100 | #337 | Tragic 96.4% |
| Immigrants | Cabo Verde | 0.0 /100 | #338 | Tragic 96.3% |
| Guatemalans | 0.0 /100 | #339 | Tragic 96.3% |
| Immigrants | Guatemala | 0.0 /100 | #340 | Tragic 96.2% |
| Immigrants | Central America | 0.0 /100 | #341 | Tragic 96.2% |
| Immigrants | Mexico | 0.0 /100 | #342 | Tragic 96.1% |
| Nepalese | 0.0 /100 | #343 | Tragic 96.1% |