Osage vs Hmong Doctorate Degree
COMPARE
Osage
Hmong
Doctorate Degree
Doctorate Degree Comparison
Osage
Hmong
1.7%
DOCTORATE DEGREE
6.5/ 100
METRIC RATING
226th/ 347
METRIC RANK
1.6%
DOCTORATE DEGREE
1.8/ 100
METRIC RATING
246th/ 347
METRIC RANK
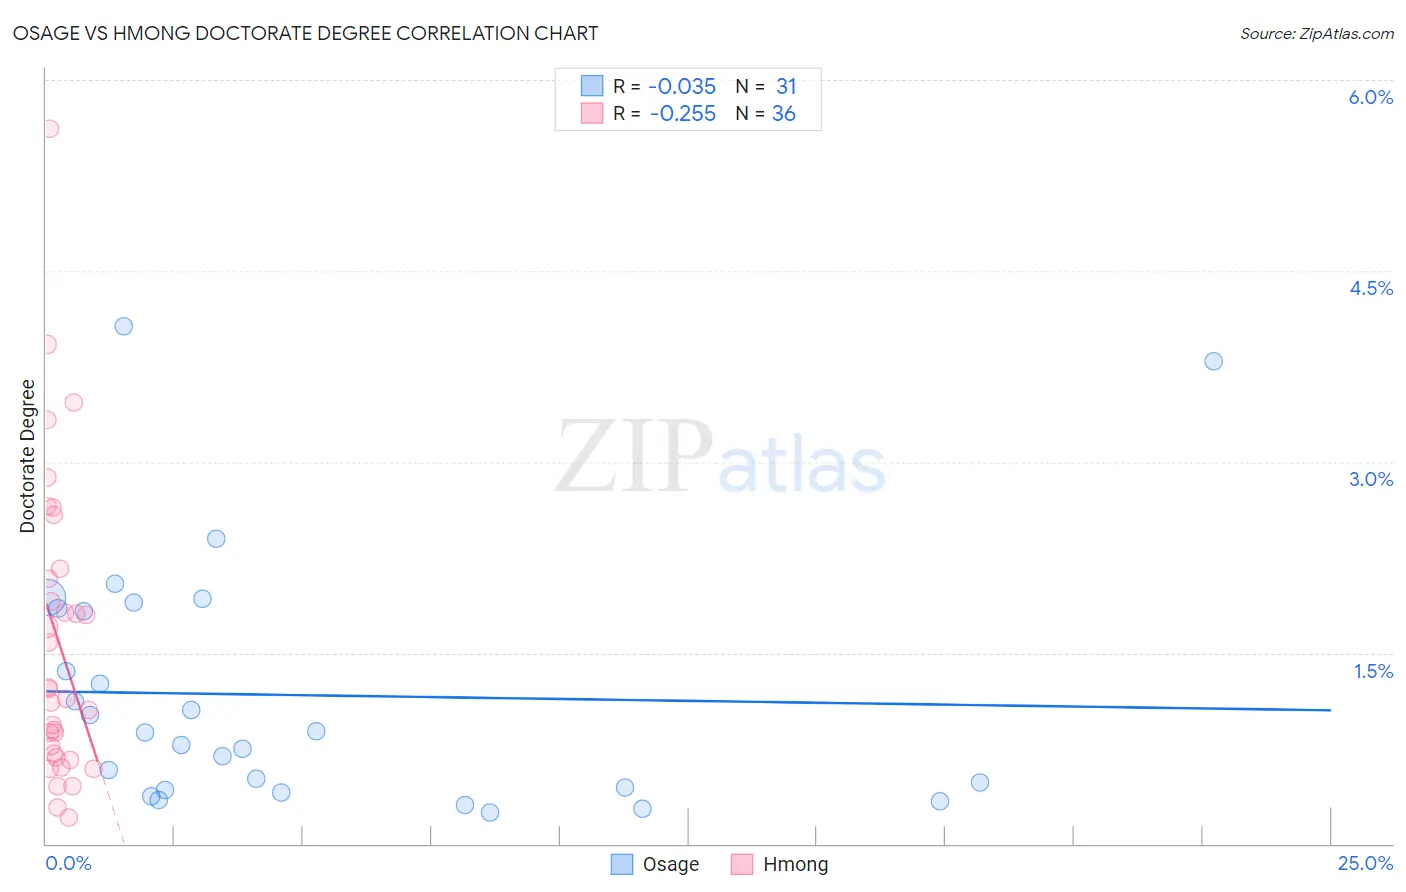
Osage vs Hmong Doctorate Degree Correlation Chart
The statistical analysis conducted on geographies consisting of 91,292,964 people shows no correlation between the proportion of Osage and percentage of population with at least doctorate degree education in the United States with a correlation coefficient (R) of -0.035 and weighted average of 1.7%. Similarly, the statistical analysis conducted on geographies consisting of 24,653,481 people shows a weak negative correlation between the proportion of Hmong and percentage of population with at least doctorate degree education in the United States with a correlation coefficient (R) of -0.255 and weighted average of 1.6%, a difference of 5.6%.
Doctorate Degree Correlation Summary
| Measurement | Osage | Hmong |
| Minimum | 0.25% | 0.21% |
| Maximum | 4.1% | 5.6% |
| Range | 3.8% | 5.4% |
| Mean | 1.2% | 1.6% |
| Median | 0.87% | 1.2% |
| Interquartile 25% (IQ1) | 0.42% | 0.69% |
| Interquartile 75% (IQ3) | 1.9% | 2.1% |
| Interquartile Range (IQR) | 1.4% | 1.4% |
| Standard Deviation (Sample) | 0.97% | 1.2% |
| Standard Deviation (Population) | 0.96% | 1.2% |
Demographics Similar to Osage and Hmong by Doctorate Degree
In terms of doctorate degree, the demographic groups most similar to Osage are Panamanian (1.7%, a difference of 0.14%), Assyrian/Chaldean/Syriac (1.7%, a difference of 0.42%), Colville (1.6%, a difference of 1.4%), Immigrants from Philippines (1.6%, a difference of 1.8%), and Immigrants from North Macedonia (1.6%, a difference of 2.2%). Similarly, the demographic groups most similar to Hmong are Delaware (1.6%, a difference of 0.10%), French American Indian (1.6%, a difference of 0.47%), Native Hawaiian (1.6%, a difference of 0.66%), Ottawa (1.6%, a difference of 0.79%), and Cheyenne (1.6%, a difference of 1.0%).
| Demographics | Rating | Rank | Doctorate Degree |
| Osage | 6.5 /100 | #226 | Tragic 1.7% |
| Panamanians | 6.3 /100 | #227 | Tragic 1.7% |
| Assyrians/Chaldeans/Syriacs | 5.9 /100 | #228 | Tragic 1.7% |
| Colville | 4.7 /100 | #229 | Tragic 1.6% |
| Immigrants | Philippines | 4.3 /100 | #230 | Tragic 1.6% |
| Immigrants | North Macedonia | 3.9 /100 | #231 | Tragic 1.6% |
| Guamanians/Chamorros | 3.3 /100 | #232 | Tragic 1.6% |
| Barbadians | 3.3 /100 | #233 | Tragic 1.6% |
| Hopi | 3.2 /100 | #234 | Tragic 1.6% |
| Cree | 3.0 /100 | #235 | Tragic 1.6% |
| Indonesians | 2.8 /100 | #236 | Tragic 1.6% |
| Iroquois | 2.7 /100 | #237 | Tragic 1.6% |
| Immigrants | Congo | 2.6 /100 | #238 | Tragic 1.6% |
| West Indians | 2.5 /100 | #239 | Tragic 1.6% |
| Immigrants | Panama | 2.4 /100 | #240 | Tragic 1.6% |
| Cheyenne | 2.3 /100 | #241 | Tragic 1.6% |
| Ottawa | 2.2 /100 | #242 | Tragic 1.6% |
| Native Hawaiians | 2.1 /100 | #243 | Tragic 1.6% |
| French American Indians | 2.0 /100 | #244 | Tragic 1.6% |
| Delaware | 1.9 /100 | #245 | Tragic 1.6% |
| Hmong | 1.8 /100 | #246 | Tragic 1.6% |