Immigrants from India vs Hopi Professional Degree
COMPARE
Immigrants from India
Hopi
Professional Degree
Professional Degree Comparison
Immigrants from India
Hopi
6.2%
PROFESSIONAL DEGREE
100.0/ 100
METRIC RATING
31st/ 347
METRIC RANK
3.6%
PROFESSIONAL DEGREE
0.9/ 100
METRIC RATING
263rd/ 347
METRIC RANK
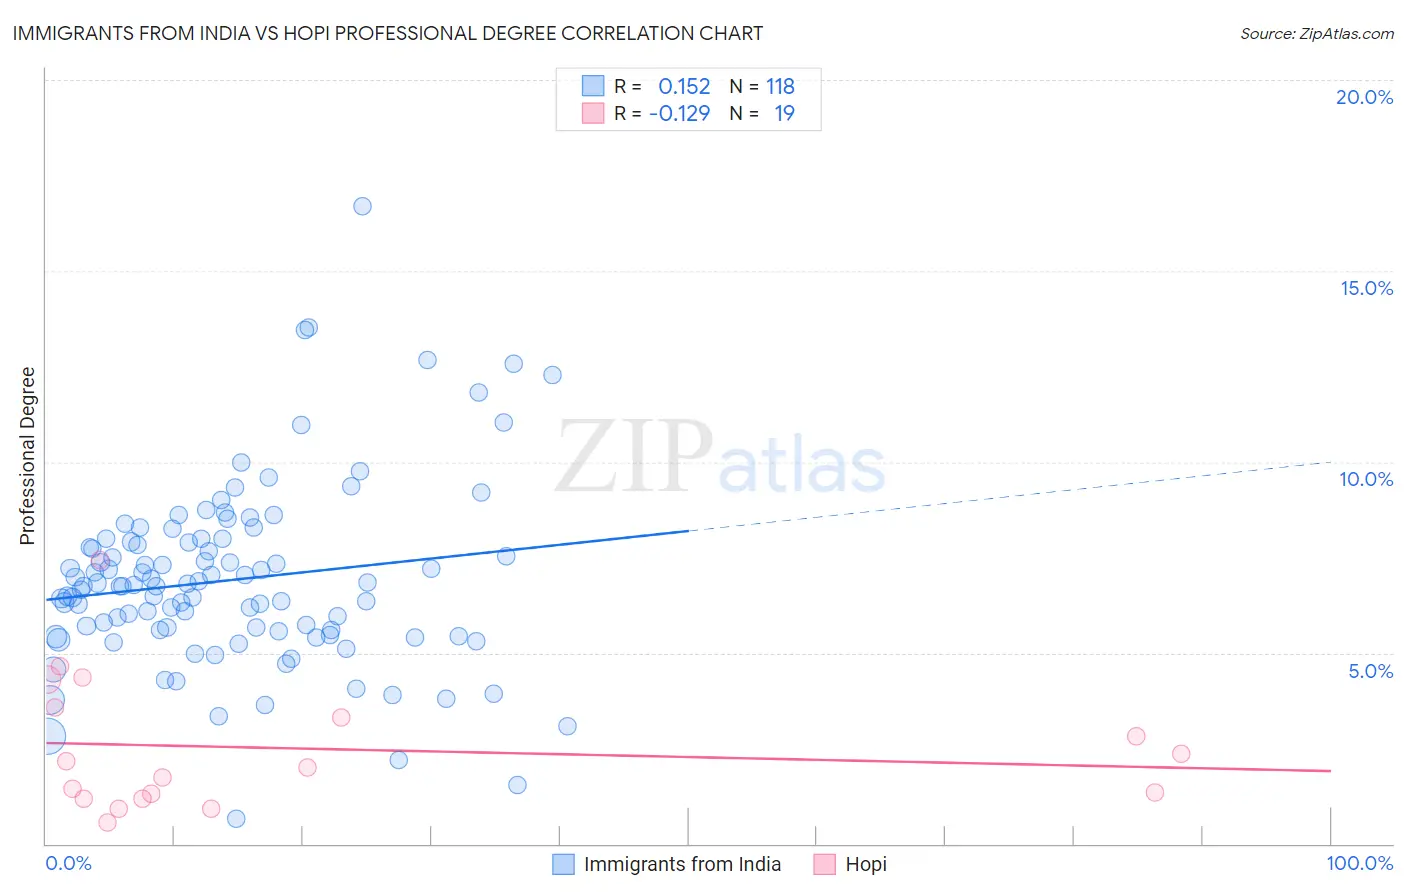
Immigrants from India vs Hopi Professional Degree Correlation Chart
The statistical analysis conducted on geographies consisting of 433,211,421 people shows a poor positive correlation between the proportion of Immigrants from India and percentage of population with at least professional degree education in the United States with a correlation coefficient (R) of 0.152 and weighted average of 6.2%. Similarly, the statistical analysis conducted on geographies consisting of 74,597,003 people shows a poor negative correlation between the proportion of Hopi and percentage of population with at least professional degree education in the United States with a correlation coefficient (R) of -0.129 and weighted average of 3.6%, a difference of 69.0%.
Professional Degree Correlation Summary
| Measurement | Immigrants from India | Hopi |
| Minimum | 0.66% | 0.54% |
| Maximum | 16.7% | 7.4% |
| Range | 16.0% | 6.9% |
| Mean | 6.9% | 2.5% |
| Median | 6.7% | 2.0% |
| Interquartile 25% (IQ1) | 5.6% | 1.2% |
| Interquartile 75% (IQ3) | 7.9% | 3.6% |
| Interquartile Range (IQR) | 2.3% | 2.4% |
| Standard Deviation (Sample) | 2.4% | 1.7% |
| Standard Deviation (Population) | 2.4% | 1.7% |
Similar Demographics by Professional Degree
Demographics Similar to Immigrants from India by Professional Degree
In terms of professional degree, the demographic groups most similar to Immigrants from India are Immigrants from Sri Lanka (6.2%, a difference of 0.12%), Immigrants from Turkey (6.2%, a difference of 0.12%), Thai (6.1%, a difference of 0.23%), Burmese (6.1%, a difference of 0.27%), and Mongolian (6.1%, a difference of 0.40%).
| Demographics | Rating | Rank | Professional Degree |
| Immigrants | Spain | 100.0 /100 | #24 | Exceptional 6.3% |
| Immigrants | Ireland | 100.0 /100 | #25 | Exceptional 6.3% |
| Latvians | 100.0 /100 | #26 | Exceptional 6.2% |
| Immigrants | Northern Europe | 100.0 /100 | #27 | Exceptional 6.2% |
| Turks | 100.0 /100 | #28 | Exceptional 6.2% |
| Immigrants | Sri Lanka | 100.0 /100 | #29 | Exceptional 6.2% |
| Immigrants | Turkey | 100.0 /100 | #30 | Exceptional 6.2% |
| Immigrants | India | 100.0 /100 | #31 | Exceptional 6.2% |
| Thais | 100.0 /100 | #32 | Exceptional 6.1% |
| Burmese | 100.0 /100 | #33 | Exceptional 6.1% |
| Mongolians | 100.0 /100 | #34 | Exceptional 6.1% |
| Immigrants | Korea | 100.0 /100 | #35 | Exceptional 6.1% |
| Immigrants | Russia | 100.0 /100 | #36 | Exceptional 6.0% |
| Immigrants | Austria | 100.0 /100 | #37 | Exceptional 6.0% |
| Immigrants | Norway | 100.0 /100 | #38 | Exceptional 6.0% |
Demographics Similar to Hopi by Professional Degree
In terms of professional degree, the demographic groups most similar to Hopi are Immigrants from Cambodia (3.6%, a difference of 0.020%), Immigrants from Congo (3.6%, a difference of 0.060%), Central American Indian (3.6%, a difference of 0.38%), U.S. Virgin Islander (3.7%, a difference of 0.50%), and Immigrants from Guyana (3.7%, a difference of 0.51%).
| Demographics | Rating | Rank | Professional Degree |
| Iroquois | 1.2 /100 | #256 | Tragic 3.7% |
| Bahamians | 1.1 /100 | #257 | Tragic 3.7% |
| Immigrants | St. Vincent and the Grenadines | 1.1 /100 | #258 | Tragic 3.7% |
| Africans | 1.0 /100 | #259 | Tragic 3.7% |
| Indonesians | 1.0 /100 | #260 | Tragic 3.7% |
| Immigrants | Guyana | 1.0 /100 | #261 | Tragic 3.7% |
| U.S. Virgin Islanders | 1.0 /100 | #262 | Tragic 3.7% |
| Hopi | 0.9 /100 | #263 | Tragic 3.6% |
| Immigrants | Cambodia | 0.9 /100 | #264 | Tragic 3.6% |
| Immigrants | Congo | 0.8 /100 | #265 | Tragic 3.6% |
| Central American Indians | 0.8 /100 | #266 | Tragic 3.6% |
| Delaware | 0.7 /100 | #267 | Tragic 3.6% |
| Aleuts | 0.7 /100 | #268 | Tragic 3.6% |
| Immigrants | Cuba | 0.6 /100 | #269 | Tragic 3.6% |
| Central Americans | 0.6 /100 | #270 | Tragic 3.6% |