French vs Belizean Doctorate Degree
COMPARE
French
Belizean
Doctorate Degree
Doctorate Degree Comparison
French
Belizeans
1.8%
DOCTORATE DEGREE
48.8/ 100
METRIC RATING
178th/ 347
METRIC RANK
1.4%
DOCTORATE DEGREE
0.1/ 100
METRIC RATING
299th/ 347
METRIC RANK
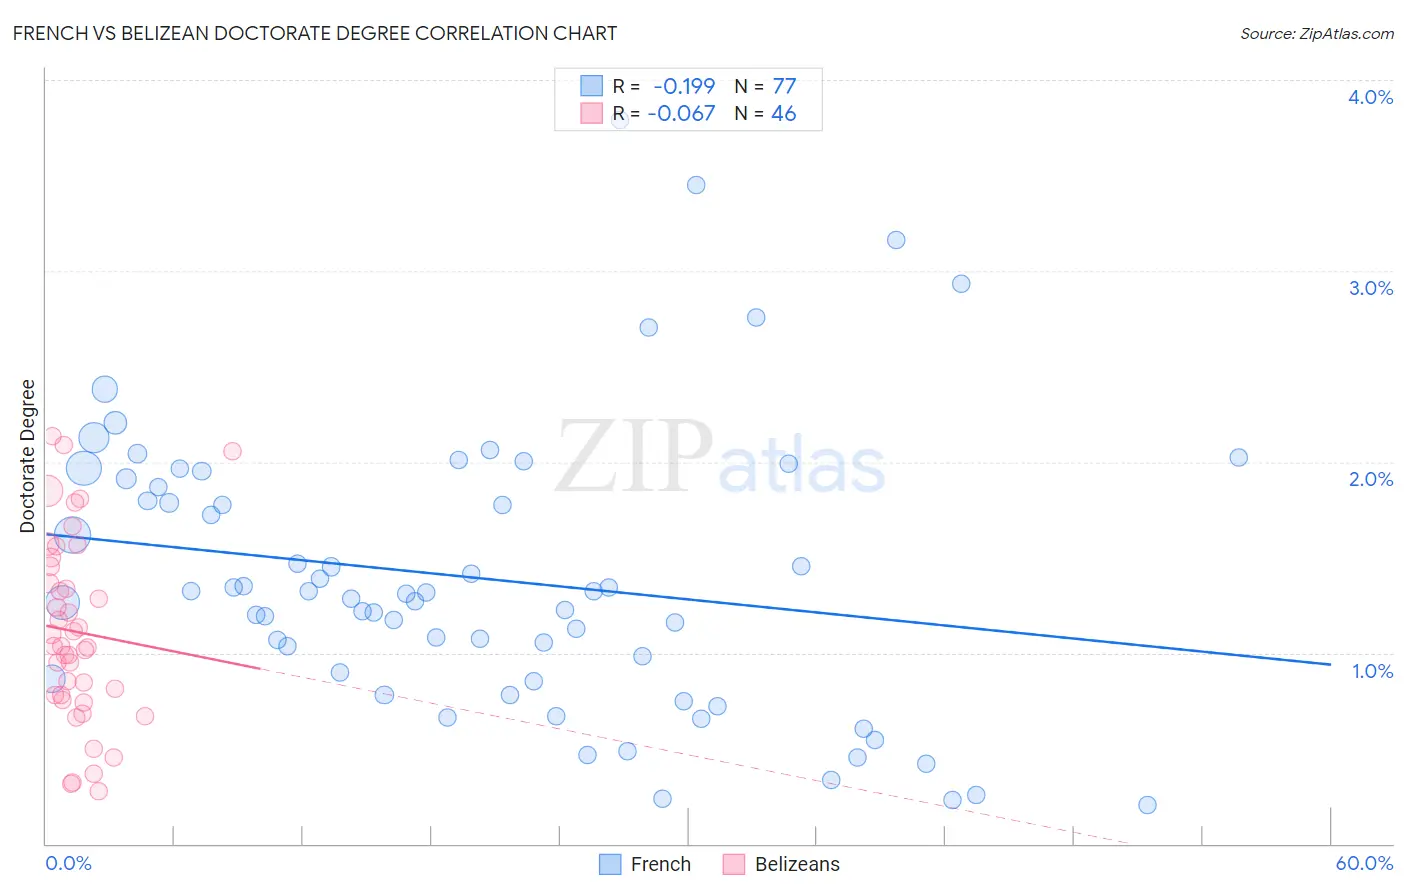
French vs Belizean Doctorate Degree Correlation Chart
The statistical analysis conducted on geographies consisting of 547,467,794 people shows a poor negative correlation between the proportion of French and percentage of population with at least doctorate degree education in the United States with a correlation coefficient (R) of -0.199 and weighted average of 1.8%. Similarly, the statistical analysis conducted on geographies consisting of 143,625,069 people shows a slight negative correlation between the proportion of Belizeans and percentage of population with at least doctorate degree education in the United States with a correlation coefficient (R) of -0.067 and weighted average of 1.4%, a difference of 31.7%.
Doctorate Degree Correlation Summary
| Measurement | French | Belizean |
| Minimum | 0.20% | 0.28% |
| Maximum | 3.8% | 2.1% |
| Range | 3.6% | 1.9% |
| Mean | 1.4% | 1.1% |
| Median | 1.3% | 1.0% |
| Interquartile 25% (IQ1) | 0.86% | 0.78% |
| Interquartile 75% (IQ3) | 1.9% | 1.5% |
| Interquartile Range (IQR) | 1.0% | 0.68% |
| Standard Deviation (Sample) | 0.75% | 0.48% |
| Standard Deviation (Population) | 0.74% | 0.48% |
Similar Demographics by Doctorate Degree
Demographics Similar to French by Doctorate Degree
In terms of doctorate degree, the demographic groups most similar to French are Iraqi (1.8%, a difference of 0.060%), Spanish (1.8%, a difference of 0.070%), Ghanaian (1.8%, a difference of 0.070%), Immigrants from Thailand (1.8%, a difference of 0.090%), and Scandinavian (1.8%, a difference of 0.12%).
| Demographics | Rating | Rank | Doctorate Degree |
| Bermudans | 52.1 /100 | #171 | Average 1.8% |
| Belgians | 50.3 /100 | #172 | Average 1.8% |
| Norwegians | 50.0 /100 | #173 | Average 1.8% |
| Immigrants | Bangladesh | 50.0 /100 | #174 | Average 1.8% |
| Immigrants | Thailand | 49.4 /100 | #175 | Average 1.8% |
| Spanish | 49.3 /100 | #176 | Average 1.8% |
| Iraqis | 49.2 /100 | #177 | Average 1.8% |
| French | 48.8 /100 | #178 | Average 1.8% |
| Ghanaians | 48.3 /100 | #179 | Average 1.8% |
| Scandinavians | 48.0 /100 | #180 | Average 1.8% |
| Immigrants | Immigrants | 46.2 /100 | #181 | Average 1.8% |
| Immigrants | Afghanistan | 44.3 /100 | #182 | Average 1.8% |
| Finns | 42.1 /100 | #183 | Average 1.8% |
| Nigerians | 39.9 /100 | #184 | Fair 1.8% |
| Slovaks | 36.4 /100 | #185 | Fair 1.8% |
Demographics Similar to Belizeans by Doctorate Degree
In terms of doctorate degree, the demographic groups most similar to Belizeans are Immigrants from Guatemala (1.4%, a difference of 0.33%), Honduran (1.4%, a difference of 0.40%), Puerto Rican (1.4%, a difference of 0.43%), Shoshone (1.4%, a difference of 0.73%), and Immigrants from Dominica (1.4%, a difference of 0.76%).
| Demographics | Rating | Rank | Doctorate Degree |
| Alaska Natives | 0.3 /100 | #292 | Tragic 1.4% |
| Immigrants | Yemen | 0.2 /100 | #293 | Tragic 1.4% |
| Samoans | 0.2 /100 | #294 | Tragic 1.4% |
| Guatemalans | 0.2 /100 | #295 | Tragic 1.4% |
| Immigrants | Ecuador | 0.2 /100 | #296 | Tragic 1.4% |
| Tsimshian | 0.2 /100 | #297 | Tragic 1.4% |
| Puerto Ricans | 0.1 /100 | #298 | Tragic 1.4% |
| Belizeans | 0.1 /100 | #299 | Tragic 1.4% |
| Immigrants | Guatemala | 0.1 /100 | #300 | Tragic 1.4% |
| Hondurans | 0.1 /100 | #301 | Tragic 1.4% |
| Shoshone | 0.1 /100 | #302 | Tragic 1.4% |
| Immigrants | Dominica | 0.1 /100 | #303 | Tragic 1.4% |
| Mexican American Indians | 0.1 /100 | #304 | Tragic 1.4% |
| Pennsylvania Germans | 0.1 /100 | #305 | Tragic 1.4% |
| Guyanese | 0.1 /100 | #306 | Tragic 1.4% |