Immigrants from Hungary vs Immigrants from Kenya 12th Grade, No Diploma
COMPARE
Immigrants from Hungary
Immigrants from Kenya
12th Grade, No Diploma
12th Grade, No Diploma Comparison
Immigrants from Hungary
Immigrants from Kenya
92.1%
12TH GRADE, NO DIPLOMA
97.0/ 100
METRIC RATING
109th/ 347
METRIC RANK
91.5%
12TH GRADE, NO DIPLOMA
73.9/ 100
METRIC RATING
154th/ 347
METRIC RANK
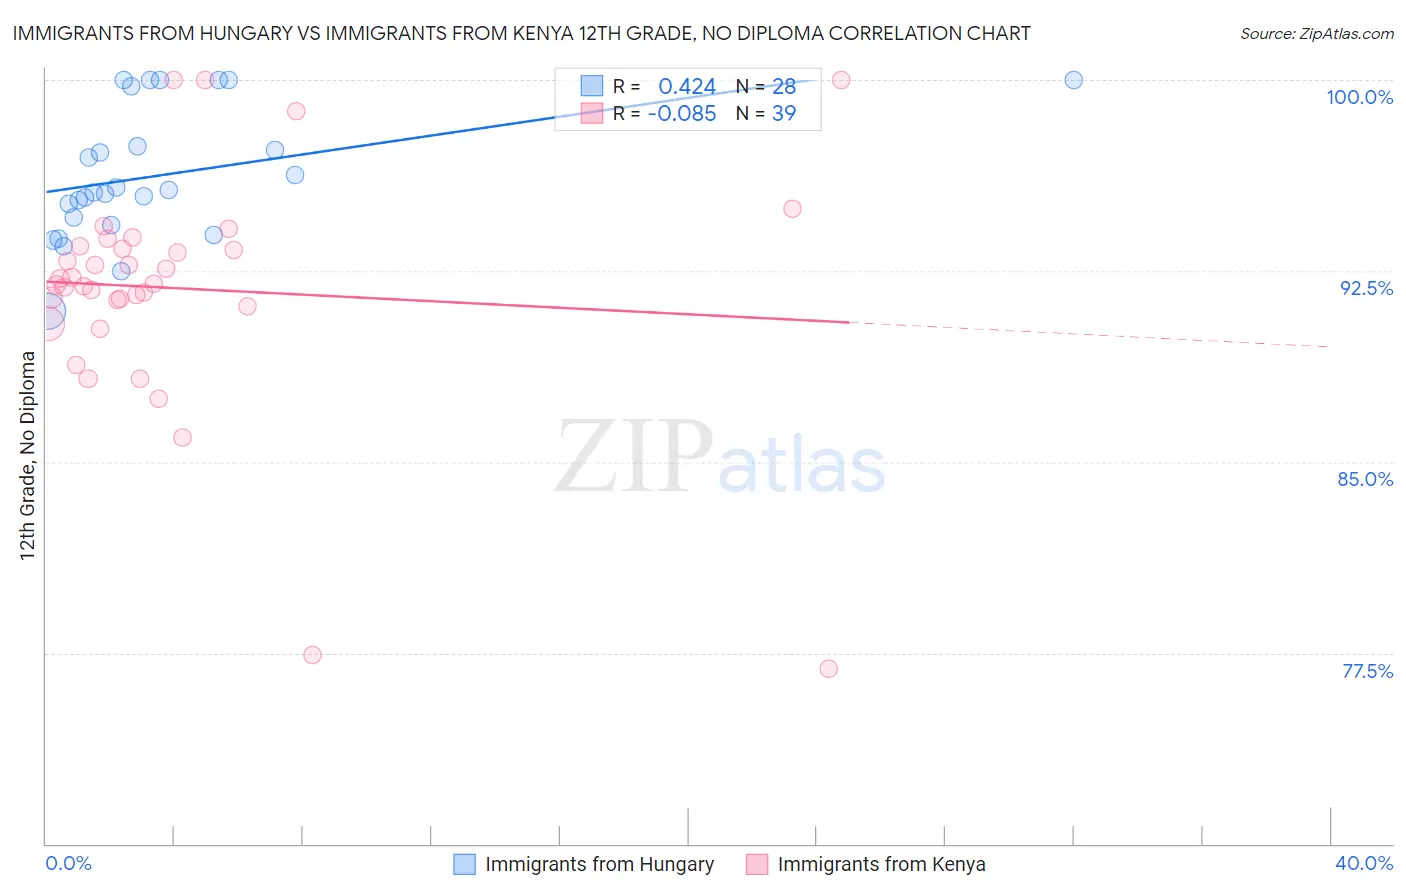
Immigrants from Hungary vs Immigrants from Kenya 12th Grade, No Diploma Correlation Chart
The statistical analysis conducted on geographies consisting of 195,707,305 people shows a moderate positive correlation between the proportion of Immigrants from Hungary and percentage of population with at least 12th grade (no diploma) education in the United States with a correlation coefficient (R) of 0.424 and weighted average of 92.1%. Similarly, the statistical analysis conducted on geographies consisting of 218,076,690 people shows a slight negative correlation between the proportion of Immigrants from Kenya and percentage of population with at least 12th grade (no diploma) education in the United States with a correlation coefficient (R) of -0.085 and weighted average of 91.5%, a difference of 0.75%.
12th Grade, No Diploma Correlation Summary
| Measurement | Immigrants from Hungary | Immigrants from Kenya |
| Minimum | 90.9% | 76.9% |
| Maximum | 100.0% | 100.0% |
| Range | 9.1% | 23.1% |
| Mean | 96.3% | 91.8% |
| Median | 95.6% | 92.0% |
| Interquartile 25% (IQ1) | 94.5% | 91.1% |
| Interquartile 75% (IQ3) | 98.6% | 93.5% |
| Interquartile Range (IQR) | 4.1% | 2.4% |
| Standard Deviation (Sample) | 2.6% | 4.6% |
| Standard Deviation (Population) | 2.5% | 4.6% |
Similar Demographics by 12th Grade, No Diploma
Demographics Similar to Immigrants from Hungary by 12th Grade, No Diploma
In terms of 12th grade, no diploma, the demographic groups most similar to Immigrants from Hungary are Palestinian (92.1%, a difference of 0.0%), Immigrants from Greece (92.1%, a difference of 0.010%), Syrian (92.2%, a difference of 0.020%), Jordanian (92.2%, a difference of 0.020%), and Israeli (92.1%, a difference of 0.020%).
| Demographics | Rating | Rank | 12th Grade, No Diploma |
| Alaskan Athabascans | 98.1 /100 | #102 | Exceptional 92.3% |
| Immigrants | Norway | 98.1 /100 | #103 | Exceptional 92.3% |
| Lebanese | 97.6 /100 | #104 | Exceptional 92.2% |
| Immigrants | Belarus | 97.4 /100 | #105 | Exceptional 92.2% |
| Immigrants | Russia | 97.3 /100 | #106 | Exceptional 92.2% |
| Syrians | 97.2 /100 | #107 | Exceptional 92.2% |
| Jordanians | 97.2 /100 | #108 | Exceptional 92.2% |
| Immigrants | Hungary | 97.0 /100 | #109 | Exceptional 92.1% |
| Palestinians | 97.0 /100 | #110 | Exceptional 92.1% |
| Immigrants | Greece | 96.9 /100 | #111 | Exceptional 92.1% |
| Israelis | 96.8 /100 | #112 | Exceptional 92.1% |
| Immigrants | Zimbabwe | 96.5 /100 | #113 | Exceptional 92.1% |
| Yugoslavians | 96.5 /100 | #114 | Exceptional 92.1% |
| Immigrants | Sri Lanka | 96.4 /100 | #115 | Exceptional 92.1% |
| Aleuts | 96.3 /100 | #116 | Exceptional 92.1% |
Demographics Similar to Immigrants from Kenya by 12th Grade, No Diploma
In terms of 12th grade, no diploma, the demographic groups most similar to Immigrants from Kenya are Immigrants from Iraq (91.4%, a difference of 0.010%), Iraqi (91.5%, a difference of 0.020%), Asian (91.4%, a difference of 0.030%), Immigrants from Pakistan (91.4%, a difference of 0.050%), and Kenyan (91.5%, a difference of 0.060%).
| Demographics | Rating | Rank | 12th Grade, No Diploma |
| Pakistanis | 79.6 /100 | #147 | Good 91.5% |
| Indians (Asian) | 79.4 /100 | #148 | Good 91.5% |
| Ugandans | 79.0 /100 | #149 | Good 91.5% |
| Paraguayans | 78.9 /100 | #150 | Good 91.5% |
| Chippewa | 78.8 /100 | #151 | Good 91.5% |
| Kenyans | 77.4 /100 | #152 | Good 91.5% |
| Iraqis | 75.3 /100 | #153 | Good 91.5% |
| Immigrants | Kenya | 73.9 /100 | #154 | Good 91.5% |
| Immigrants | Iraq | 73.0 /100 | #155 | Good 91.4% |
| Asians | 71.9 /100 | #156 | Good 91.4% |
| Immigrants | Pakistan | 70.7 /100 | #157 | Good 91.4% |
| Immigrants | Northern Africa | 66.2 /100 | #158 | Good 91.4% |
| Laotians | 64.4 /100 | #159 | Good 91.3% |
| Immigrants | Albania | 64.1 /100 | #160 | Good 91.3% |
| Immigrants | Hong Kong | 63.8 /100 | #161 | Good 91.3% |