Immigrants from Hong Kong vs Swiss 6th Grade
COMPARE
Immigrants from Hong Kong
Swiss
6th Grade
6th Grade Comparison
Immigrants from Hong Kong
Swiss
96.3%
6TH GRADE
0.2/ 100
METRIC RATING
271st/ 347
METRIC RANK
97.9%
6TH GRADE
100.0/ 100
METRIC RATING
34th/ 347
METRIC RANK
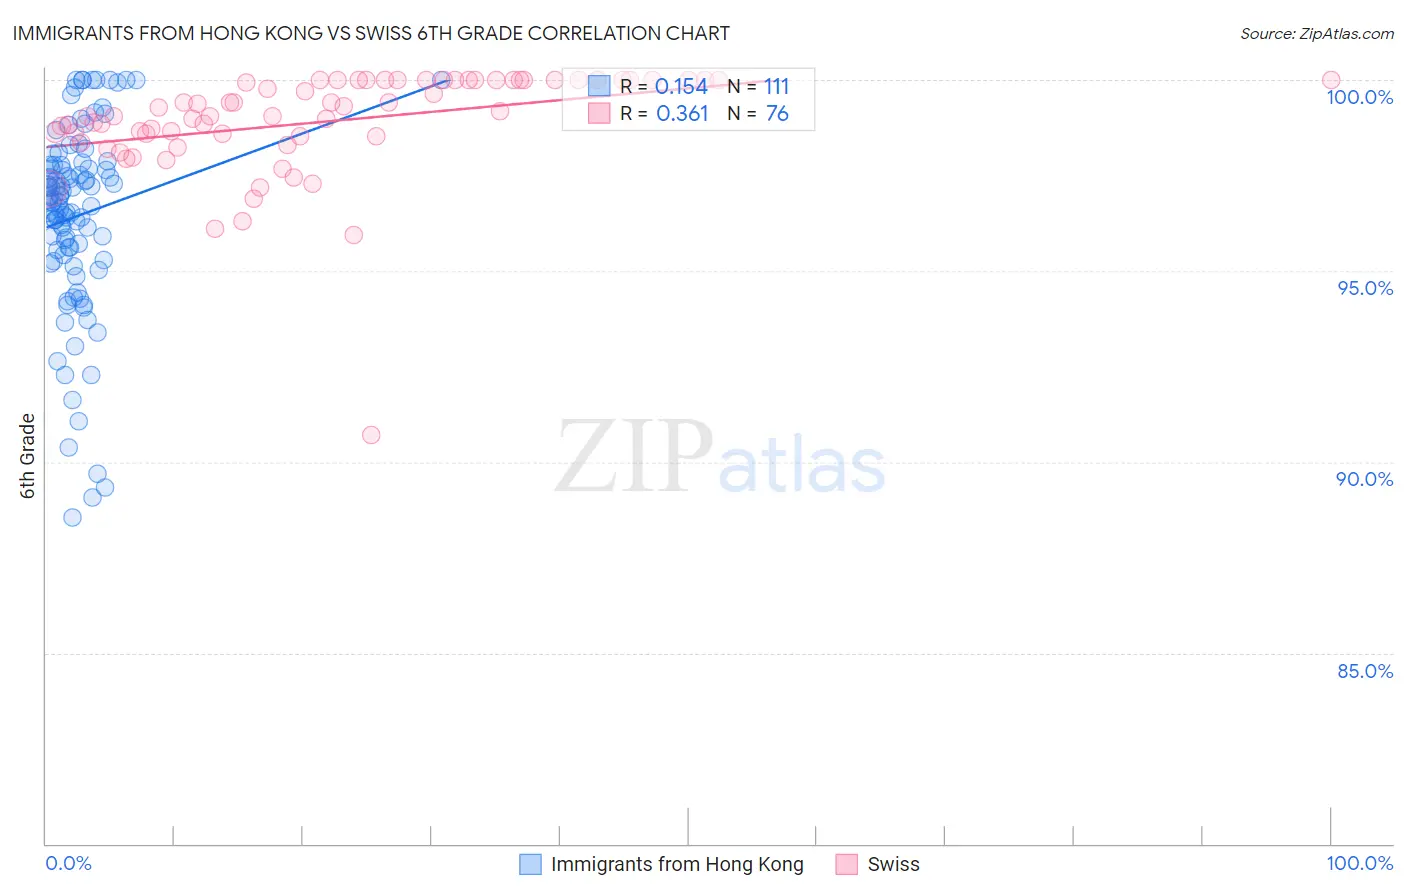
Immigrants from Hong Kong vs Swiss 6th Grade Correlation Chart
The statistical analysis conducted on geographies consisting of 253,909,193 people shows a poor positive correlation between the proportion of Immigrants from Hong Kong and percentage of population with at least 6th grade education in the United States with a correlation coefficient (R) of 0.154 and weighted average of 96.3%. Similarly, the statistical analysis conducted on geographies consisting of 465,021,856 people shows a mild positive correlation between the proportion of Swiss and percentage of population with at least 6th grade education in the United States with a correlation coefficient (R) of 0.361 and weighted average of 97.9%, a difference of 1.7%.
6th Grade Correlation Summary
| Measurement | Immigrants from Hong Kong | Swiss |
| Minimum | 88.6% | 90.7% |
| Maximum | 100.0% | 100.0% |
| Range | 11.4% | 9.3% |
| Mean | 96.4% | 98.9% |
| Median | 96.9% | 99.1% |
| Interquartile 25% (IQ1) | 95.4% | 98.5% |
| Interquartile 75% (IQ3) | 97.8% | 100.0% |
| Interquartile Range (IQR) | 2.4% | 1.5% |
| Standard Deviation (Sample) | 2.5% | 1.4% |
| Standard Deviation (Population) | 2.5% | 1.4% |
Similar Demographics by 6th Grade
Demographics Similar to Immigrants from Hong Kong by 6th Grade
In terms of 6th grade, the demographic groups most similar to Immigrants from Hong Kong are Immigrants from Uzbekistan (96.3%, a difference of 0.010%), West Indian (96.3%, a difference of 0.010%), Immigrants from South America (96.3%, a difference of 0.010%), Immigrants from Bolivia (96.3%, a difference of 0.030%), and Ghanaian (96.4%, a difference of 0.040%).
| Demographics | Rating | Rank | 6th Grade |
| Armenians | 0.3 /100 | #264 | Tragic 96.4% |
| Immigrants | Jamaica | 0.2 /100 | #265 | Tragic 96.4% |
| Ghanaians | 0.2 /100 | #266 | Tragic 96.4% |
| Afghans | 0.2 /100 | #267 | Tragic 96.4% |
| Immigrants | Uzbekistan | 0.2 /100 | #268 | Tragic 96.3% |
| West Indians | 0.2 /100 | #269 | Tragic 96.3% |
| Immigrants | South America | 0.2 /100 | #270 | Tragic 96.3% |
| Immigrants | Hong Kong | 0.2 /100 | #271 | Tragic 96.3% |
| Immigrants | Bolivia | 0.1 /100 | #272 | Tragic 96.3% |
| Immigrants | Cameroon | 0.1 /100 | #273 | Tragic 96.3% |
| Immigrants | Philippines | 0.1 /100 | #274 | Tragic 96.3% |
| Immigrants | Ghana | 0.1 /100 | #275 | Tragic 96.3% |
| Yaqui | 0.1 /100 | #276 | Tragic 96.3% |
| Immigrants | Western Africa | 0.1 /100 | #277 | Tragic 96.3% |
| Immigrants | Thailand | 0.1 /100 | #278 | Tragic 96.3% |
Demographics Similar to Swiss by 6th Grade
In terms of 6th grade, the demographic groups most similar to Swiss are Chippewa (97.9%, a difference of 0.0%), Chinese (97.9%, a difference of 0.020%), Italian (97.9%, a difference of 0.030%), British (97.9%, a difference of 0.030%), and Alaska Native (98.0%, a difference of 0.040%).
| Demographics | Rating | Rank | 6th Grade |
| Yup'ik | 100.0 /100 | #27 | Exceptional 98.0% |
| Scandinavians | 100.0 /100 | #28 | Exceptional 98.0% |
| French | 100.0 /100 | #29 | Exceptional 98.0% |
| French Canadians | 100.0 /100 | #30 | Exceptional 98.0% |
| Europeans | 100.0 /100 | #31 | Exceptional 98.0% |
| Alaska Natives | 100.0 /100 | #32 | Exceptional 98.0% |
| Chippewa | 100.0 /100 | #33 | Exceptional 97.9% |
| Swiss | 100.0 /100 | #34 | Exceptional 97.9% |
| Chinese | 100.0 /100 | #35 | Exceptional 97.9% |
| Italians | 100.0 /100 | #36 | Exceptional 97.9% |
| British | 100.0 /100 | #37 | Exceptional 97.9% |
| Belgians | 100.0 /100 | #38 | Exceptional 97.9% |
| Luxembourgers | 99.9 /100 | #39 | Exceptional 97.9% |
| Latvians | 99.9 /100 | #40 | Exceptional 97.9% |
| Eastern Europeans | 99.9 /100 | #41 | Exceptional 97.9% |