Immigrants from Hong Kong vs Immigrants from Asia Kindergarten
COMPARE
Immigrants from Hong Kong
Immigrants from Asia
Kindergarten
Kindergarten Comparison
Immigrants from Hong Kong
Immigrants from Asia
97.3%
KINDERGARTEN
0.0/ 100
METRIC RATING
287th/ 347
METRIC RANK
97.6%
KINDERGARTEN
0.8/ 100
METRIC RATING
254th/ 347
METRIC RANK
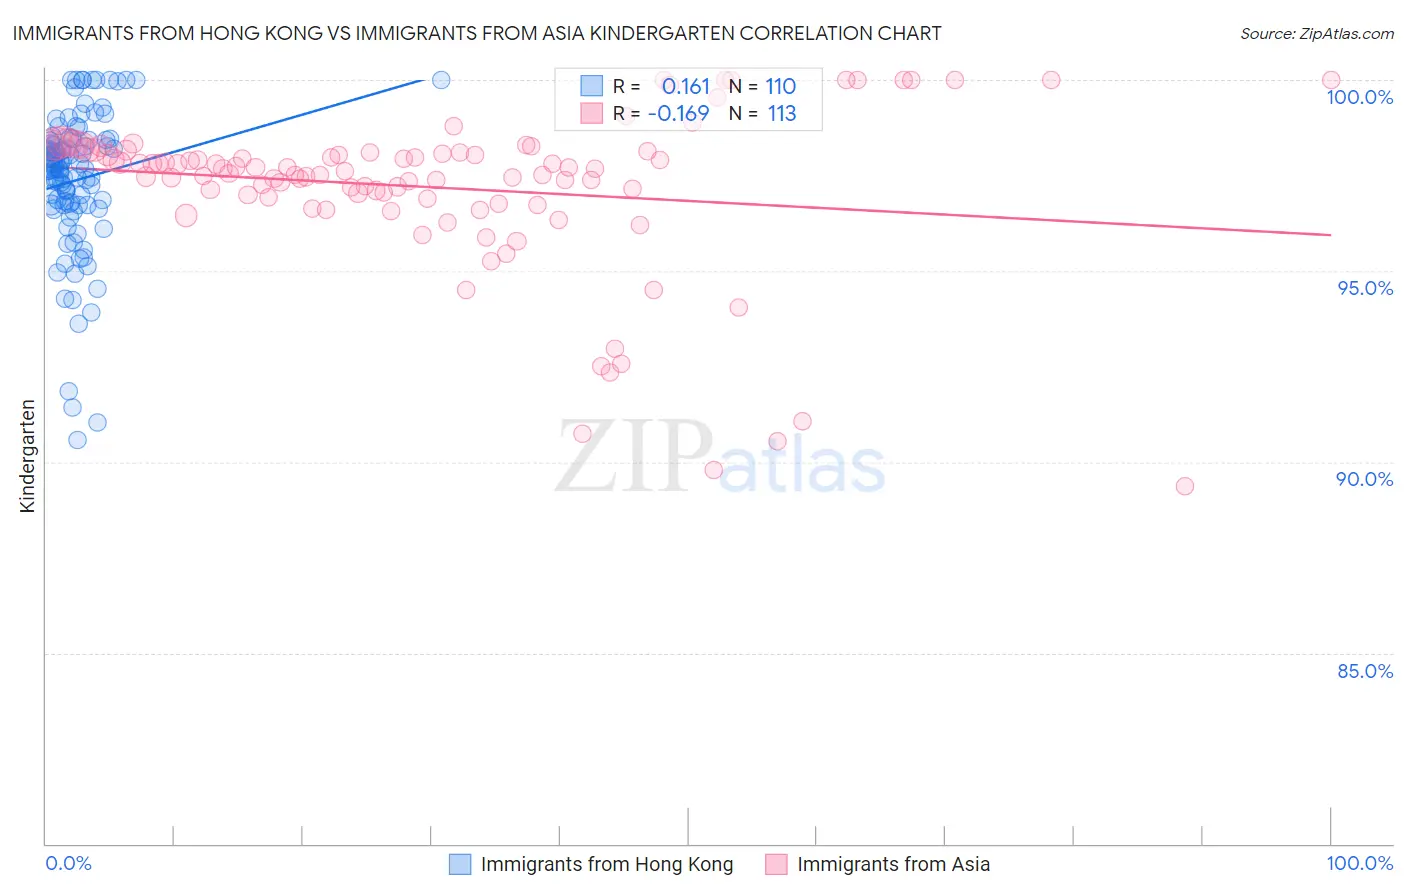
Immigrants from Hong Kong vs Immigrants from Asia Kindergarten Correlation Chart
The statistical analysis conducted on geographies consisting of 253,948,669 people shows a poor positive correlation between the proportion of Immigrants from Hong Kong and percentage of population with at least kindergarten education in the United States with a correlation coefficient (R) of 0.161 and weighted average of 97.3%. Similarly, the statistical analysis conducted on geographies consisting of 549,170,546 people shows a poor negative correlation between the proportion of Immigrants from Asia and percentage of population with at least kindergarten education in the United States with a correlation coefficient (R) of -0.169 and weighted average of 97.6%, a difference of 0.27%.
Kindergarten Correlation Summary
| Measurement | Immigrants from Hong Kong | Immigrants from Asia |
| Minimum | 90.6% | 89.4% |
| Maximum | 100.0% | 100.0% |
| Range | 9.4% | 10.6% |
| Mean | 97.4% | 97.2% |
| Median | 97.7% | 97.7% |
| Interquartile 25% (IQ1) | 96.7% | 96.9% |
| Interquartile 75% (IQ3) | 98.4% | 98.1% |
| Interquartile Range (IQR) | 1.7% | 1.2% |
| Standard Deviation (Sample) | 1.9% | 2.1% |
| Standard Deviation (Population) | 1.9% | 2.1% |
Similar Demographics by Kindergarten
Demographics Similar to Immigrants from Hong Kong by Kindergarten
In terms of kindergarten, the demographic groups most similar to Immigrants from Hong Kong are Immigrants from Barbados (97.3%, a difference of 0.0%), Immigrants from Portugal (97.3%, a difference of 0.010%), Immigrants from Thailand (97.3%, a difference of 0.010%), Immigrants from Trinidad and Tobago (97.3%, a difference of 0.020%), and Immigrants from West Indies (97.3%, a difference of 0.030%).
| Demographics | Rating | Rank | Kindergarten |
| Barbadians | 0.1 /100 | #280 | Tragic 97.4% |
| Trinidadians and Tobagonians | 0.1 /100 | #281 | Tragic 97.4% |
| Afghans | 0.0 /100 | #282 | Tragic 97.4% |
| Immigrants | West Indies | 0.0 /100 | #283 | Tragic 97.3% |
| Immigrants | Trinidad and Tobago | 0.0 /100 | #284 | Tragic 97.3% |
| Immigrants | Portugal | 0.0 /100 | #285 | Tragic 97.3% |
| Immigrants | Barbados | 0.0 /100 | #286 | Tragic 97.3% |
| Immigrants | Hong Kong | 0.0 /100 | #287 | Tragic 97.3% |
| Immigrants | Thailand | 0.0 /100 | #288 | Tragic 97.3% |
| Immigrants | Afghanistan | 0.0 /100 | #289 | Tragic 97.3% |
| Immigrants | St. Vincent and the Grenadines | 0.0 /100 | #290 | Tragic 97.3% |
| Houma | 0.0 /100 | #291 | Tragic 97.3% |
| British West Indians | 0.0 /100 | #292 | Tragic 97.3% |
| Malaysians | 0.0 /100 | #293 | Tragic 97.2% |
| Immigrants | Immigrants | 0.0 /100 | #294 | Tragic 97.2% |
Demographics Similar to Immigrants from Asia by Kindergarten
In terms of kindergarten, the demographic groups most similar to Immigrants from Asia are Immigrants from Congo (97.6%, a difference of 0.0%), Yaqui (97.6%, a difference of 0.0%), Ethiopian (97.6%, a difference of 0.010%), Immigrants from Iraq (97.6%, a difference of 0.010%), and Immigrants from Africa (97.6%, a difference of 0.010%).
| Demographics | Rating | Rank | Kindergarten |
| Immigrants | Eastern Africa | 1.0 /100 | #247 | Tragic 97.6% |
| Immigrants | Middle Africa | 1.0 /100 | #248 | Tragic 97.6% |
| Peruvians | 1.0 /100 | #249 | Tragic 97.6% |
| Immigrants | Senegal | 0.9 /100 | #250 | Tragic 97.6% |
| Ethiopians | 0.9 /100 | #251 | Tragic 97.6% |
| Immigrants | Iraq | 0.9 /100 | #252 | Tragic 97.6% |
| Immigrants | Africa | 0.8 /100 | #253 | Tragic 97.6% |
| Immigrants | Asia | 0.8 /100 | #254 | Tragic 97.6% |
| Immigrants | Congo | 0.8 /100 | #255 | Tragic 97.6% |
| Yaqui | 0.7 /100 | #256 | Tragic 97.6% |
| Immigrants | Colombia | 0.6 /100 | #257 | Tragic 97.6% |
| Jamaicans | 0.6 /100 | #258 | Tragic 97.6% |
| Armenians | 0.5 /100 | #259 | Tragic 97.6% |
| Fijians | 0.5 /100 | #260 | Tragic 97.5% |
| Taiwanese | 0.4 /100 | #261 | Tragic 97.5% |