Immigrants from Hong Kong vs Bangladeshi Kindergarten
COMPARE
Immigrants from Hong Kong
Bangladeshi
Kindergarten
Kindergarten Comparison
Immigrants from Hong Kong
Bangladeshis
97.3%
KINDERGARTEN
0.0/ 100
METRIC RATING
287th/ 347
METRIC RANK
96.6%
KINDERGARTEN
0.0/ 100
METRIC RATING
335th/ 347
METRIC RANK
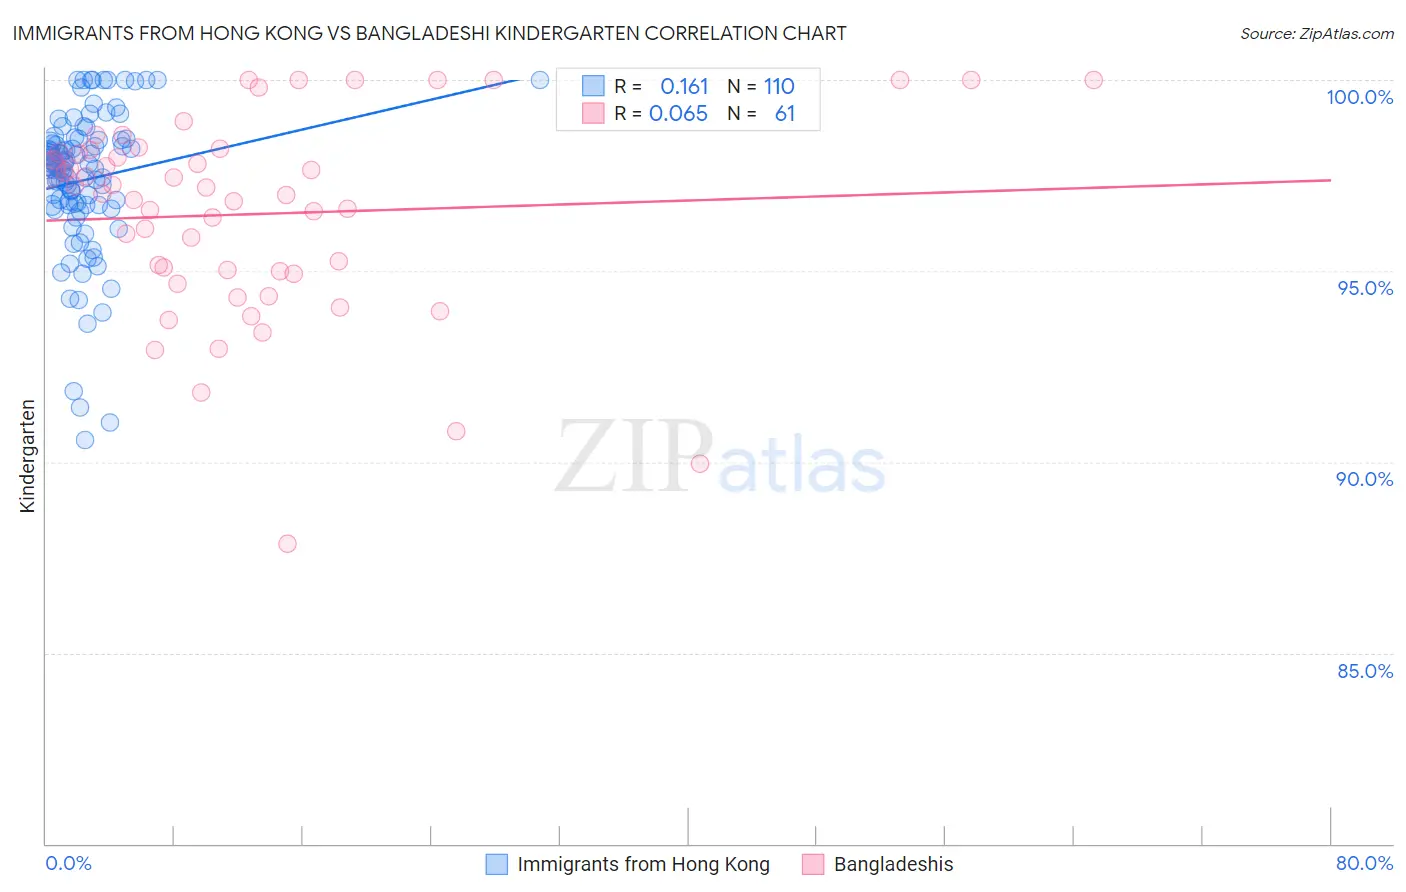
Immigrants from Hong Kong vs Bangladeshi Kindergarten Correlation Chart
The statistical analysis conducted on geographies consisting of 253,948,669 people shows a poor positive correlation between the proportion of Immigrants from Hong Kong and percentage of population with at least kindergarten education in the United States with a correlation coefficient (R) of 0.161 and weighted average of 97.3%. Similarly, the statistical analysis conducted on geographies consisting of 141,430,495 people shows a slight positive correlation between the proportion of Bangladeshis and percentage of population with at least kindergarten education in the United States with a correlation coefficient (R) of 0.065 and weighted average of 96.6%, a difference of 0.78%.
Kindergarten Correlation Summary
| Measurement | Immigrants from Hong Kong | Bangladeshi |
| Minimum | 90.6% | 87.9% |
| Maximum | 100.0% | 100.0% |
| Range | 9.4% | 12.1% |
| Mean | 97.4% | 96.5% |
| Median | 97.7% | 97.0% |
| Interquartile 25% (IQ1) | 96.7% | 95.0% |
| Interquartile 75% (IQ3) | 98.4% | 98.1% |
| Interquartile Range (IQR) | 1.7% | 3.2% |
| Standard Deviation (Sample) | 1.9% | 2.6% |
| Standard Deviation (Population) | 1.9% | 2.6% |
Similar Demographics by Kindergarten
Demographics Similar to Immigrants from Hong Kong by Kindergarten
In terms of kindergarten, the demographic groups most similar to Immigrants from Hong Kong are Immigrants from Barbados (97.3%, a difference of 0.0%), Immigrants from Portugal (97.3%, a difference of 0.010%), Immigrants from Thailand (97.3%, a difference of 0.010%), Immigrants from Trinidad and Tobago (97.3%, a difference of 0.020%), and Immigrants from West Indies (97.3%, a difference of 0.030%).
| Demographics | Rating | Rank | Kindergarten |
| Barbadians | 0.1 /100 | #280 | Tragic 97.4% |
| Trinidadians and Tobagonians | 0.1 /100 | #281 | Tragic 97.4% |
| Afghans | 0.0 /100 | #282 | Tragic 97.4% |
| Immigrants | West Indies | 0.0 /100 | #283 | Tragic 97.3% |
| Immigrants | Trinidad and Tobago | 0.0 /100 | #284 | Tragic 97.3% |
| Immigrants | Portugal | 0.0 /100 | #285 | Tragic 97.3% |
| Immigrants | Barbados | 0.0 /100 | #286 | Tragic 97.3% |
| Immigrants | Hong Kong | 0.0 /100 | #287 | Tragic 97.3% |
| Immigrants | Thailand | 0.0 /100 | #288 | Tragic 97.3% |
| Immigrants | Afghanistan | 0.0 /100 | #289 | Tragic 97.3% |
| Immigrants | St. Vincent and the Grenadines | 0.0 /100 | #290 | Tragic 97.3% |
| Houma | 0.0 /100 | #291 | Tragic 97.3% |
| British West Indians | 0.0 /100 | #292 | Tragic 97.3% |
| Malaysians | 0.0 /100 | #293 | Tragic 97.2% |
| Immigrants | Immigrants | 0.0 /100 | #294 | Tragic 97.2% |
Demographics Similar to Bangladeshis by Kindergarten
In terms of kindergarten, the demographic groups most similar to Bangladeshis are Immigrants from Dominican Republic (96.6%, a difference of 0.0%), Central American (96.6%, a difference of 0.030%), Guatemalan (96.5%, a difference of 0.030%), Yakama (96.6%, a difference of 0.050%), and Immigrants from Armenia (96.6%, a difference of 0.070%).
| Demographics | Rating | Rank | Kindergarten |
| Immigrants | Latin America | 0.0 /100 | #328 | Tragic 96.7% |
| Immigrants | Vietnam | 0.0 /100 | #329 | Tragic 96.7% |
| Japanese | 0.0 /100 | #330 | Tragic 96.7% |
| Immigrants | Armenia | 0.0 /100 | #331 | Tragic 96.6% |
| Yakama | 0.0 /100 | #332 | Tragic 96.6% |
| Central Americans | 0.0 /100 | #333 | Tragic 96.6% |
| Immigrants | Dominican Republic | 0.0 /100 | #334 | Tragic 96.6% |
| Bangladeshis | 0.0 /100 | #335 | Tragic 96.6% |
| Guatemalans | 0.0 /100 | #336 | Tragic 96.5% |
| Immigrants | Cambodia | 0.0 /100 | #337 | Tragic 96.5% |
| Immigrants | Fiji | 0.0 /100 | #338 | Tragic 96.5% |
| Immigrants | Guatemala | 0.0 /100 | #339 | Tragic 96.4% |
| Immigrants | Central America | 0.0 /100 | #340 | Tragic 96.4% |
| Immigrants | Cabo Verde | 0.0 /100 | #341 | Tragic 96.4% |
| Immigrants | Mexico | 0.0 /100 | #342 | Tragic 96.4% |