Immigrants from Honduras vs Pakistani Master's Degree
COMPARE
Immigrants from Honduras
Pakistani
Master's Degree
Master's Degree Comparison
Immigrants from Honduras
Pakistanis
11.8%
MASTER'S DEGREE
0.1/ 100
METRIC RATING
288th/ 347
METRIC RANK
15.8%
MASTER'S DEGREE
86.1/ 100
METRIC RATING
138th/ 347
METRIC RANK
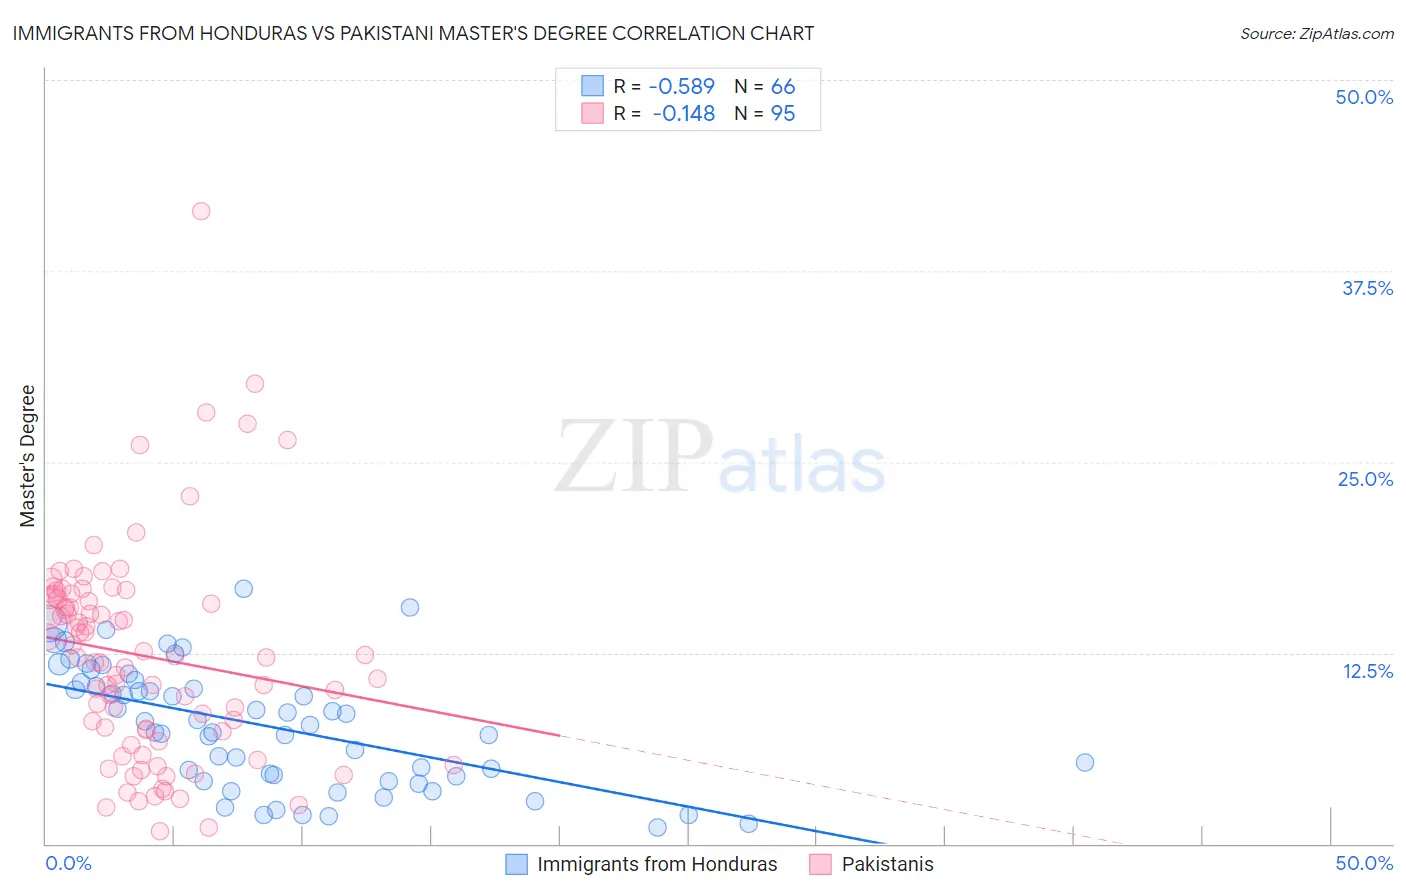
Immigrants from Honduras vs Pakistani Master's Degree Correlation Chart
The statistical analysis conducted on geographies consisting of 322,506,731 people shows a substantial negative correlation between the proportion of Immigrants from Honduras and percentage of population with at least master's degree education in the United States with a correlation coefficient (R) of -0.589 and weighted average of 11.8%. Similarly, the statistical analysis conducted on geographies consisting of 335,288,248 people shows a poor negative correlation between the proportion of Pakistanis and percentage of population with at least master's degree education in the United States with a correlation coefficient (R) of -0.148 and weighted average of 15.8%, a difference of 34.3%.
Master's Degree Correlation Summary
| Measurement | Immigrants from Honduras | Pakistani |
| Minimum | 1.1% | 0.80% |
| Maximum | 16.7% | 41.4% |
| Range | 15.6% | 40.6% |
| Mean | 7.7% | 12.3% |
| Median | 7.9% | 12.2% |
| Interquartile 25% (IQ1) | 4.4% | 7.4% |
| Interquartile 75% (IQ3) | 10.6% | 16.1% |
| Interquartile Range (IQR) | 6.2% | 8.7% |
| Standard Deviation (Sample) | 4.0% | 7.0% |
| Standard Deviation (Population) | 3.9% | 6.9% |
Similar Demographics by Master's Degree
Demographics Similar to Immigrants from Honduras by Master's Degree
In terms of master's degree, the demographic groups most similar to Immigrants from Honduras are Guatemalan (11.7%, a difference of 0.080%), Immigrants from Haiti (11.8%, a difference of 0.17%), Ute (11.7%, a difference of 0.32%), Aleut (11.8%, a difference of 0.36%), and Immigrants from Nicaragua (11.8%, a difference of 0.72%).
| Demographics | Rating | Rank | Master's Degree |
| Malaysians | 0.2 /100 | #281 | Tragic 12.0% |
| Immigrants | El Salvador | 0.2 /100 | #282 | Tragic 12.0% |
| Hondurans | 0.2 /100 | #283 | Tragic 11.9% |
| Ottawa | 0.2 /100 | #284 | Tragic 11.9% |
| Immigrants | Nicaragua | 0.2 /100 | #285 | Tragic 11.8% |
| Aleuts | 0.1 /100 | #286 | Tragic 11.8% |
| Immigrants | Haiti | 0.1 /100 | #287 | Tragic 11.8% |
| Immigrants | Honduras | 0.1 /100 | #288 | Tragic 11.8% |
| Guatemalans | 0.1 /100 | #289 | Tragic 11.7% |
| Ute | 0.1 /100 | #290 | Tragic 11.7% |
| Colville | 0.1 /100 | #291 | Tragic 11.6% |
| Immigrants | Guatemala | 0.1 /100 | #292 | Tragic 11.6% |
| Alaska Natives | 0.1 /100 | #293 | Tragic 11.6% |
| Hawaiians | 0.1 /100 | #294 | Tragic 11.6% |
| Marshallese | 0.1 /100 | #295 | Tragic 11.6% |
Demographics Similar to Pakistanis by Master's Degree
In terms of master's degree, the demographic groups most similar to Pakistanis are Immigrants from Germany (15.8%, a difference of 0.060%), European (15.8%, a difference of 0.080%), Vietnamese (15.8%, a difference of 0.14%), Assyrian/Chaldean/Syriac (15.8%, a difference of 0.18%), and Polish (15.7%, a difference of 0.27%).
| Demographics | Rating | Rank | Master's Degree |
| Taiwanese | 91.9 /100 | #131 | Exceptional 16.1% |
| Serbians | 91.7 /100 | #132 | Exceptional 16.1% |
| Immigrants | Sudan | 90.2 /100 | #133 | Exceptional 16.0% |
| Venezuelans | 88.4 /100 | #134 | Excellent 15.9% |
| South American Indians | 88.4 /100 | #135 | Excellent 15.9% |
| Assyrians/Chaldeans/Syriacs | 86.8 /100 | #136 | Excellent 15.8% |
| Europeans | 86.4 /100 | #137 | Excellent 15.8% |
| Pakistanis | 86.1 /100 | #138 | Excellent 15.8% |
| Immigrants | Germany | 85.9 /100 | #139 | Excellent 15.8% |
| Vietnamese | 85.5 /100 | #140 | Excellent 15.8% |
| Poles | 85.0 /100 | #141 | Excellent 15.7% |
| Immigrants | Africa | 84.0 /100 | #142 | Excellent 15.7% |
| Immigrants | Venezuela | 83.6 /100 | #143 | Excellent 15.7% |
| Canadians | 83.3 /100 | #144 | Excellent 15.7% |
| South Americans | 81.3 /100 | #145 | Excellent 15.6% |