Immigrants from Honduras vs Nicaraguan 11th Grade
COMPARE
Immigrants from Honduras
Nicaraguan
11th Grade
11th Grade Comparison
Immigrants from Honduras
Nicaraguans
86.9%
11TH GRADE
0.0/ 100
METRIC RATING
337th/ 347
METRIC RANK
88.9%
11TH GRADE
0.0/ 100
METRIC RATING
318th/ 347
METRIC RANK
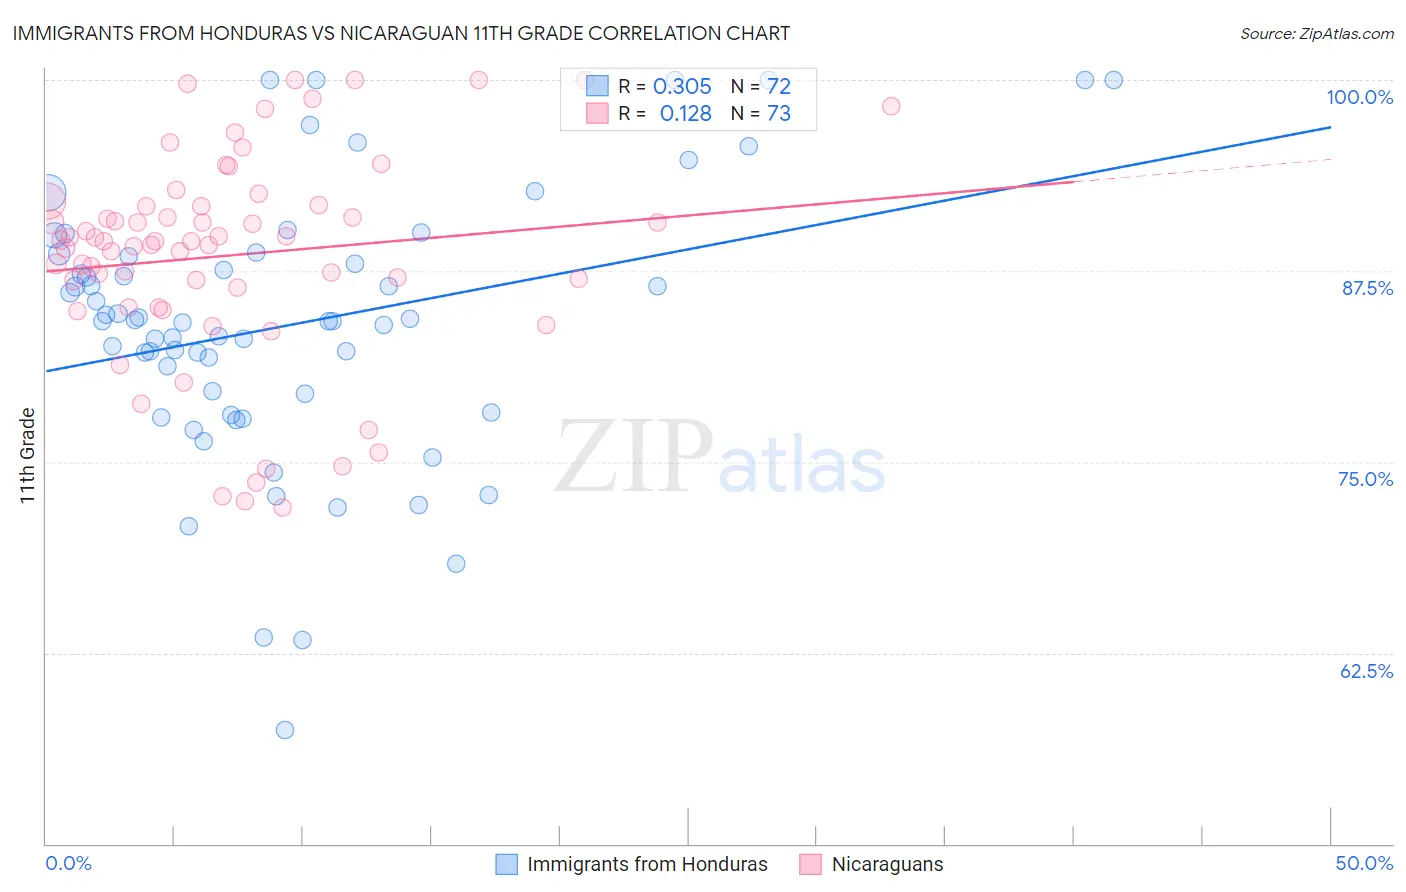
Immigrants from Honduras vs Nicaraguan 11th Grade Correlation Chart
The statistical analysis conducted on geographies consisting of 322,637,445 people shows a mild positive correlation between the proportion of Immigrants from Honduras and percentage of population with at least 11th grade education in the United States with a correlation coefficient (R) of 0.305 and weighted average of 86.9%. Similarly, the statistical analysis conducted on geographies consisting of 285,711,651 people shows a poor positive correlation between the proportion of Nicaraguans and percentage of population with at least 11th grade education in the United States with a correlation coefficient (R) of 0.128 and weighted average of 88.9%, a difference of 2.3%.
11th Grade Correlation Summary
| Measurement | Immigrants from Honduras | Nicaraguan |
| Minimum | 57.4% | 72.0% |
| Maximum | 100.0% | 100.0% |
| Range | 42.6% | 28.0% |
| Mean | 84.0% | 88.5% |
| Median | 84.2% | 89.5% |
| Interquartile 25% (IQ1) | 78.8% | 85.8% |
| Interquartile 75% (IQ3) | 88.5% | 91.8% |
| Interquartile Range (IQR) | 9.7% | 6.0% |
| Standard Deviation (Sample) | 8.9% | 6.9% |
| Standard Deviation (Population) | 8.8% | 6.8% |
Demographics Similar to Immigrants from Honduras and Nicaraguans by 11th Grade
In terms of 11th grade, the demographic groups most similar to Immigrants from Honduras are Immigrants from Dominican Republic (86.9%, a difference of 0.0%), Central American (86.9%, a difference of 0.040%), Houma (87.0%, a difference of 0.14%), Immigrants from Yemen (87.1%, a difference of 0.21%), and Immigrants from the Azores (87.2%, a difference of 0.38%). Similarly, the demographic groups most similar to Nicaraguans are Lumbee (88.9%, a difference of 0.060%), Belizean (88.8%, a difference of 0.090%), Immigrants from Armenia (88.8%, a difference of 0.11%), Immigrants from Belize (88.7%, a difference of 0.20%), and Puerto Rican (88.4%, a difference of 0.59%).
| Demographics | Rating | Rank | 11th Grade |
| Lumbee | 0.0 /100 | #317 | Tragic 88.9% |
| Nicaraguans | 0.0 /100 | #318 | Tragic 88.9% |
| Belizeans | 0.0 /100 | #319 | Tragic 88.8% |
| Immigrants | Armenia | 0.0 /100 | #320 | Tragic 88.8% |
| Immigrants | Belize | 0.0 /100 | #321 | Tragic 88.7% |
| Puerto Ricans | 0.0 /100 | #322 | Tragic 88.4% |
| Pima | 0.0 /100 | #323 | Tragic 88.3% |
| Central American Indians | 0.0 /100 | #324 | Tragic 88.2% |
| Immigrants | Nicaragua | 0.0 /100 | #325 | Tragic 88.1% |
| Dominicans | 0.0 /100 | #326 | Tragic 87.7% |
| Immigrants | Cabo Verde | 0.0 /100 | #327 | Tragic 87.6% |
| Tohono O'odham | 0.0 /100 | #328 | Tragic 87.6% |
| Mexican American Indians | 0.0 /100 | #329 | Tragic 87.5% |
| Hondurans | 0.0 /100 | #330 | Tragic 87.4% |
| Hispanics or Latinos | 0.0 /100 | #331 | Tragic 87.3% |
| Immigrants | Azores | 0.0 /100 | #332 | Tragic 87.2% |
| Immigrants | Yemen | 0.0 /100 | #333 | Tragic 87.1% |
| Houma | 0.0 /100 | #334 | Tragic 87.0% |
| Central Americans | 0.0 /100 | #335 | Tragic 86.9% |
| Immigrants | Dominican Republic | 0.0 /100 | #336 | Tragic 86.9% |
| Immigrants | Honduras | 0.0 /100 | #337 | Tragic 86.9% |