Immigrants from Singapore vs Marshallese 11th Grade
COMPARE
Immigrants from Singapore
Marshallese
11th Grade
11th Grade Comparison
Immigrants from Singapore
Marshallese
94.2%
11TH GRADE
99.9/ 100
METRIC RATING
35th/ 347
METRIC RANK
92.3%
11TH GRADE
26.0/ 100
METRIC RATING
197th/ 347
METRIC RANK
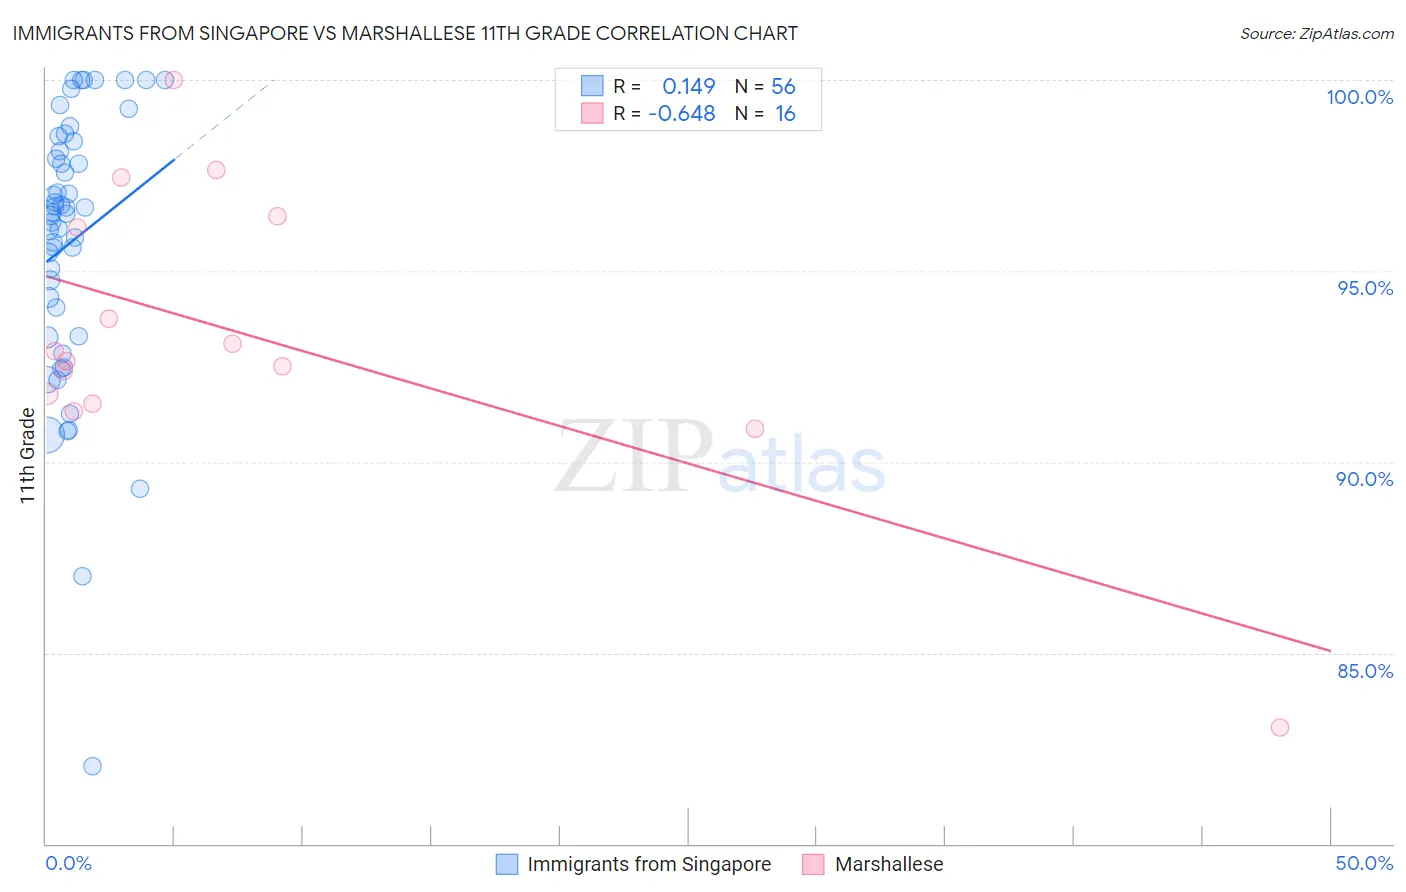
Immigrants from Singapore vs Marshallese 11th Grade Correlation Chart
The statistical analysis conducted on geographies consisting of 137,521,094 people shows a poor positive correlation between the proportion of Immigrants from Singapore and percentage of population with at least 11th grade education in the United States with a correlation coefficient (R) of 0.149 and weighted average of 94.2%. Similarly, the statistical analysis conducted on geographies consisting of 14,761,315 people shows a significant negative correlation between the proportion of Marshallese and percentage of population with at least 11th grade education in the United States with a correlation coefficient (R) of -0.648 and weighted average of 92.3%, a difference of 2.1%.
11th Grade Correlation Summary
| Measurement | Immigrants from Singapore | Marshallese |
| Minimum | 82.0% | 83.0% |
| Maximum | 100.0% | 100.0% |
| Range | 18.0% | 17.0% |
| Mean | 95.7% | 93.3% |
| Median | 96.5% | 92.8% |
| Interquartile 25% (IQ1) | 93.7% | 91.7% |
| Interquartile 75% (IQ3) | 98.3% | 96.3% |
| Interquartile Range (IQR) | 4.6% | 4.6% |
| Standard Deviation (Sample) | 3.6% | 3.8% |
| Standard Deviation (Population) | 3.6% | 3.7% |
Similar Demographics by 11th Grade
Demographics Similar to Immigrants from Singapore by 11th Grade
In terms of 11th grade, the demographic groups most similar to Immigrants from Singapore are Immigrants from Northern Europe (94.2%, a difference of 0.0%), British (94.2%, a difference of 0.010%), Immigrants from Scotland (94.2%, a difference of 0.010%), Northern European (94.2%, a difference of 0.010%), and Hungarian (94.2%, a difference of 0.010%).
| Demographics | Rating | Rank | 11th Grade |
| Estonians | 100.0 /100 | #28 | Exceptional 94.4% |
| Dutch | 100.0 /100 | #29 | Exceptional 94.3% |
| Russians | 100.0 /100 | #30 | Exceptional 94.3% |
| Welsh | 99.9 /100 | #31 | Exceptional 94.2% |
| Belgians | 99.9 /100 | #32 | Exceptional 94.2% |
| British | 99.9 /100 | #33 | Exceptional 94.2% |
| Immigrants | Scotland | 99.9 /100 | #34 | Exceptional 94.2% |
| Immigrants | Singapore | 99.9 /100 | #35 | Exceptional 94.2% |
| Immigrants | Northern Europe | 99.9 /100 | #36 | Exceptional 94.2% |
| Northern Europeans | 99.9 /100 | #37 | Exceptional 94.2% |
| Hungarians | 99.9 /100 | #38 | Exceptional 94.2% |
| Immigrants | Lithuania | 99.9 /100 | #39 | Exceptional 94.1% |
| Thais | 99.9 /100 | #40 | Exceptional 94.1% |
| Cypriots | 99.9 /100 | #41 | Exceptional 94.1% |
| Immigrants | Austria | 99.9 /100 | #42 | Exceptional 94.1% |
Demographics Similar to Marshallese by 11th Grade
In terms of 11th grade, the demographic groups most similar to Marshallese are Liberian (92.3%, a difference of 0.010%), Panamanian (92.3%, a difference of 0.010%), Hawaiian (92.3%, a difference of 0.010%), Immigrants from Uganda (92.3%, a difference of 0.010%), and Samoan (92.3%, a difference of 0.010%).
| Demographics | Rating | Rank | 11th Grade |
| Chickasaw | 31.4 /100 | #190 | Fair 92.3% |
| French American Indians | 30.8 /100 | #191 | Fair 92.3% |
| Immigrants | Syria | 30.4 /100 | #192 | Fair 92.3% |
| Moroccans | 28.7 /100 | #193 | Fair 92.3% |
| Sioux | 28.5 /100 | #194 | Fair 92.3% |
| Liberians | 26.8 /100 | #195 | Fair 92.3% |
| Panamanians | 26.4 /100 | #196 | Fair 92.3% |
| Marshallese | 26.0 /100 | #197 | Fair 92.3% |
| Hawaiians | 25.5 /100 | #198 | Fair 92.3% |
| Immigrants | Uganda | 25.2 /100 | #199 | Fair 92.3% |
| Samoans | 25.1 /100 | #200 | Fair 92.3% |
| Immigrants | China | 25.1 /100 | #201 | Fair 92.3% |
| Immigrants | Eastern Africa | 24.1 /100 | #202 | Fair 92.3% |
| Immigrants | Sudan | 23.5 /100 | #203 | Fair 92.3% |
| Immigrants | Hong Kong | 23.3 /100 | #204 | Fair 92.2% |