Immigrants from Sierra Leone vs Marshallese 11th Grade
COMPARE
Immigrants from Sierra Leone
Marshallese
11th Grade
11th Grade Comparison
Immigrants from Sierra Leone
Marshallese
92.0%
11TH GRADE
11.1/ 100
METRIC RATING
217th/ 347
METRIC RANK
92.3%
11TH GRADE
26.0/ 100
METRIC RATING
197th/ 347
METRIC RANK
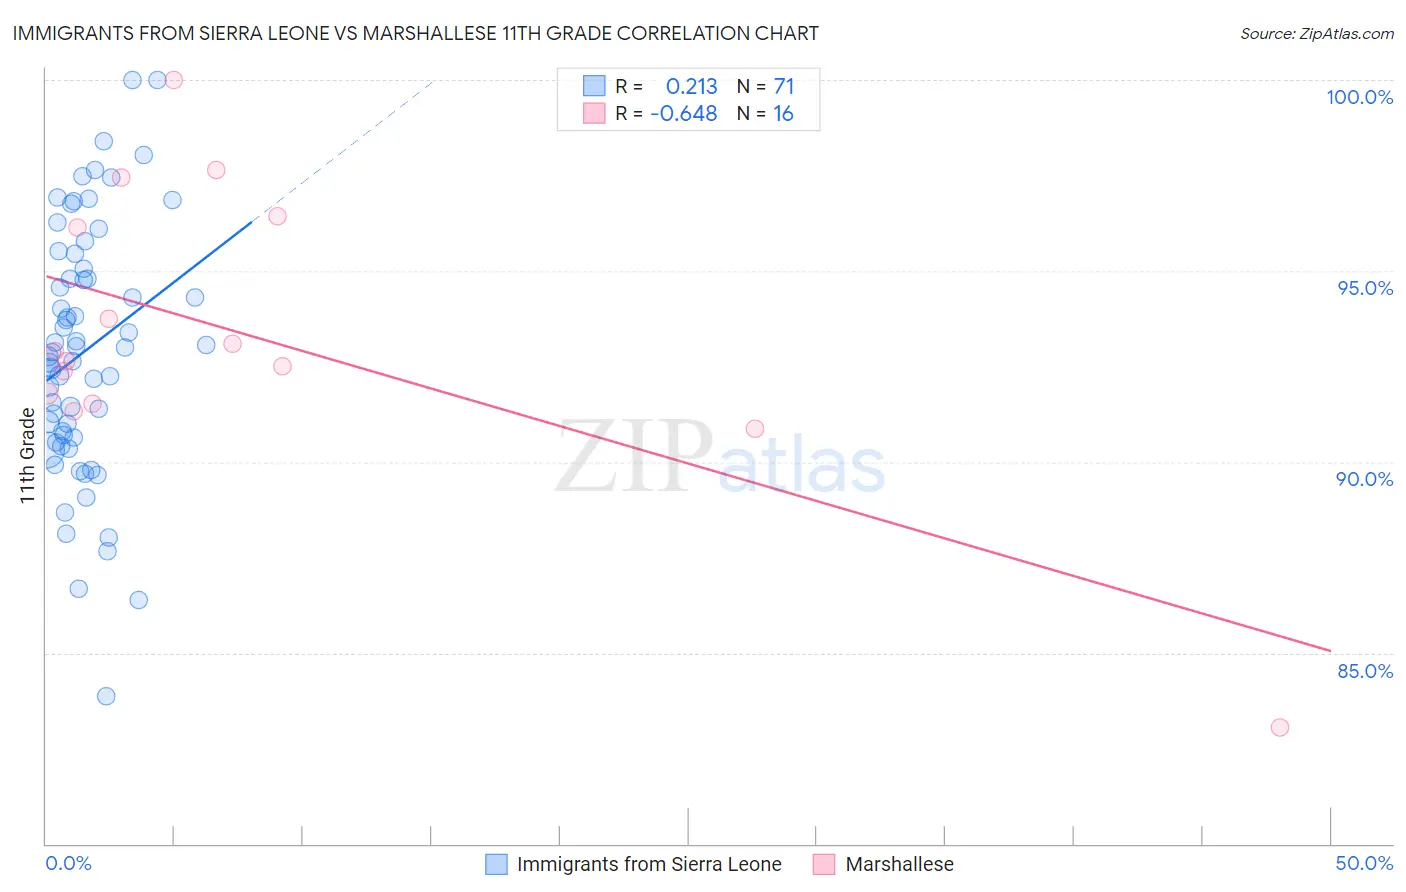
Immigrants from Sierra Leone vs Marshallese 11th Grade Correlation Chart
The statistical analysis conducted on geographies consisting of 101,654,421 people shows a weak positive correlation between the proportion of Immigrants from Sierra Leone and percentage of population with at least 11th grade education in the United States with a correlation coefficient (R) of 0.213 and weighted average of 92.0%. Similarly, the statistical analysis conducted on geographies consisting of 14,761,315 people shows a significant negative correlation between the proportion of Marshallese and percentage of population with at least 11th grade education in the United States with a correlation coefficient (R) of -0.648 and weighted average of 92.3%, a difference of 0.26%.
11th Grade Correlation Summary
| Measurement | Immigrants from Sierra Leone | Marshallese |
| Minimum | 83.9% | 83.0% |
| Maximum | 100.0% | 100.0% |
| Range | 16.1% | 17.0% |
| Mean | 92.9% | 93.3% |
| Median | 92.9% | 92.8% |
| Interquartile 25% (IQ1) | 90.6% | 91.7% |
| Interquartile 75% (IQ3) | 95.0% | 96.3% |
| Interquartile Range (IQR) | 4.4% | 4.6% |
| Standard Deviation (Sample) | 3.3% | 3.8% |
| Standard Deviation (Population) | 3.2% | 3.7% |
Demographics Similar to Immigrants from Sierra Leone and Marshallese by 11th Grade
In terms of 11th grade, the demographic groups most similar to Immigrants from Sierra Leone are Somali (92.1%, a difference of 0.010%), Immigrants from Southern Europe (92.1%, a difference of 0.030%), Afghan (92.1%, a difference of 0.040%), Immigrants from Ethiopia (92.1%, a difference of 0.060%), and Korean (92.1%, a difference of 0.070%). Similarly, the demographic groups most similar to Marshallese are Hawaiian (92.3%, a difference of 0.010%), Immigrants from Uganda (92.3%, a difference of 0.010%), Samoan (92.3%, a difference of 0.010%), Immigrants from China (92.3%, a difference of 0.010%), and Immigrants from Eastern Africa (92.3%, a difference of 0.030%).
| Demographics | Rating | Rank | 11th Grade |
| Marshallese | 26.0 /100 | #197 | Fair 92.3% |
| Hawaiians | 25.5 /100 | #198 | Fair 92.3% |
| Immigrants | Uganda | 25.2 /100 | #199 | Fair 92.3% |
| Samoans | 25.1 /100 | #200 | Fair 92.3% |
| Immigrants | China | 25.1 /100 | #201 | Fair 92.3% |
| Immigrants | Eastern Africa | 24.1 /100 | #202 | Fair 92.3% |
| Immigrants | Sudan | 23.5 /100 | #203 | Fair 92.3% |
| Immigrants | Hong Kong | 23.3 /100 | #204 | Fair 92.2% |
| Kiowa | 23.2 /100 | #205 | Fair 92.2% |
| Bolivians | 23.2 /100 | #206 | Fair 92.2% |
| Immigrants | Oceania | 22.4 /100 | #207 | Fair 92.2% |
| Colville | 21.8 /100 | #208 | Fair 92.2% |
| Tongans | 19.8 /100 | #209 | Poor 92.2% |
| Ethiopians | 18.8 /100 | #210 | Poor 92.2% |
| Immigrants | Micronesia | 17.7 /100 | #211 | Poor 92.2% |
| Koreans | 14.4 /100 | #212 | Poor 92.1% |
| Immigrants | Ethiopia | 13.9 /100 | #213 | Poor 92.1% |
| Afghans | 12.8 /100 | #214 | Poor 92.1% |
| Immigrants | Southern Europe | 12.5 /100 | #215 | Poor 92.1% |
| Somalis | 11.6 /100 | #216 | Poor 92.1% |
| Immigrants | Sierra Leone | 11.1 /100 | #217 | Poor 92.0% |