Immigrants from Haiti vs White/Caucasian 2nd Grade
COMPARE
Immigrants from Haiti
White/Caucasian
2nd Grade
2nd Grade Comparison
Immigrants from Haiti
Whites/Caucasians
96.8%
2ND GRADE
0.0/ 100
METRIC RATING
308th/ 347
METRIC RANK
98.4%
2ND GRADE
99.8/ 100
METRIC RATING
50th/ 347
METRIC RANK
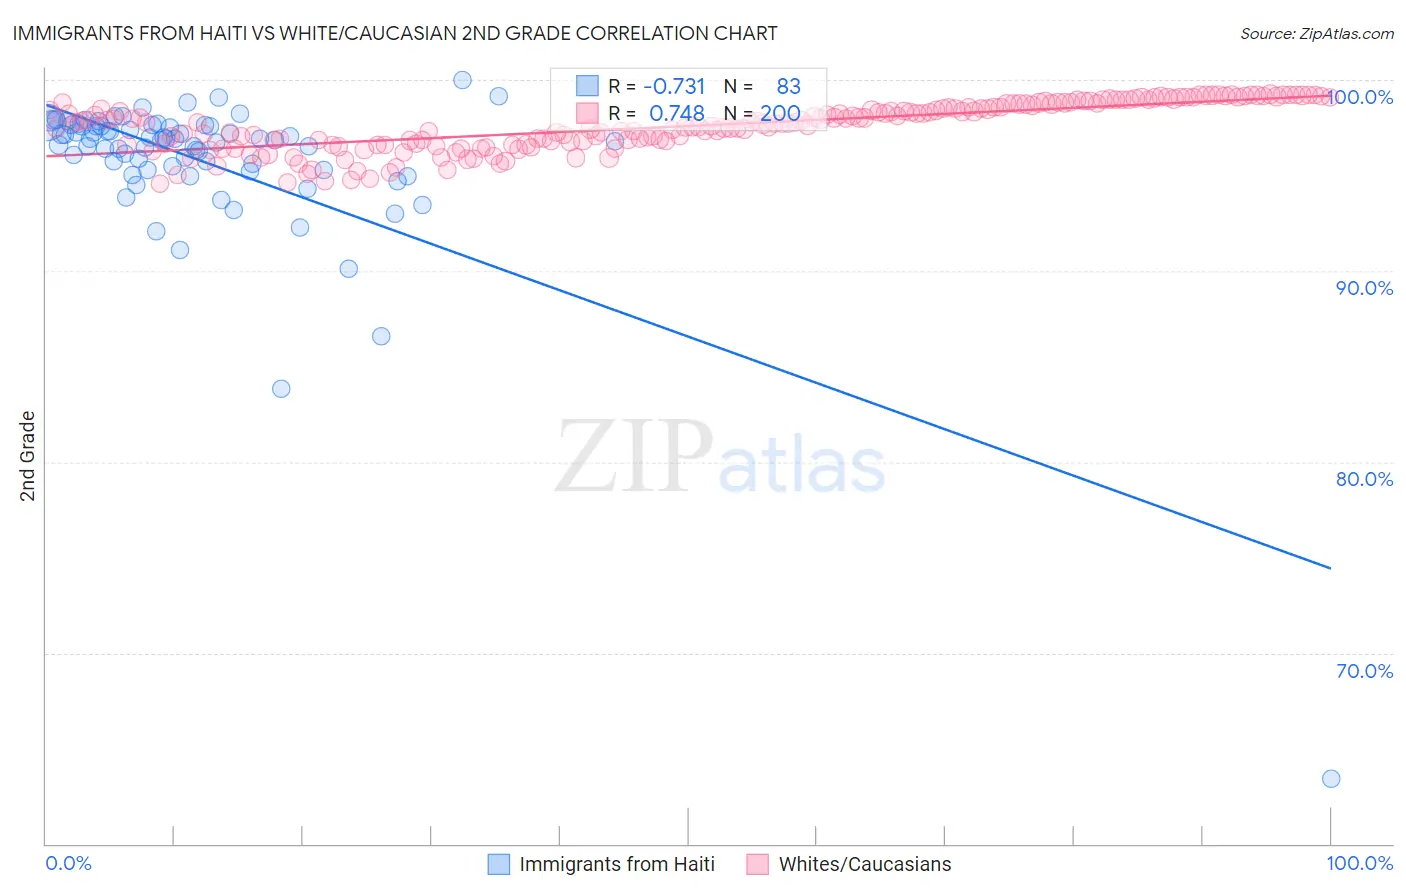
Immigrants from Haiti vs White/Caucasian 2nd Grade Correlation Chart
The statistical analysis conducted on geographies consisting of 225,286,718 people shows a strong negative correlation between the proportion of Immigrants from Haiti and percentage of population with at least 2nd grade education in the United States with a correlation coefficient (R) of -0.731 and weighted average of 96.8%. Similarly, the statistical analysis conducted on geographies consisting of 585,247,393 people shows a strong positive correlation between the proportion of Whites/Caucasians and percentage of population with at least 2nd grade education in the United States with a correlation coefficient (R) of 0.748 and weighted average of 98.4%, a difference of 1.6%.
2nd Grade Correlation Summary
| Measurement | Immigrants from Haiti | White/Caucasian |
| Minimum | 63.4% | 94.6% |
| Maximum | 100.0% | 99.3% |
| Range | 36.6% | 4.7% |
| Mean | 95.8% | 97.6% |
| Median | 96.8% | 97.7% |
| Interquartile 25% (IQ1) | 95.3% | 96.7% |
| Interquartile 75% (IQ3) | 97.6% | 98.7% |
| Interquartile Range (IQR) | 2.3% | 2.1% |
| Standard Deviation (Sample) | 4.4% | 1.2% |
| Standard Deviation (Population) | 4.3% | 1.2% |
Similar Demographics by 2nd Grade
Demographics Similar to Immigrants from Haiti by 2nd Grade
In terms of 2nd grade, the demographic groups most similar to Immigrants from Haiti are Immigrants from the Azores (96.8%, a difference of 0.010%), Belizean (96.8%, a difference of 0.010%), Sri Lankan (96.8%, a difference of 0.010%), Guyanese (96.8%, a difference of 0.020%), and Cape Verdean (96.8%, a difference of 0.020%).
| Demographics | Rating | Rank | 2nd Grade |
| Central American Indians | 0.0 /100 | #301 | Tragic 97.0% |
| Somalis | 0.0 /100 | #302 | Tragic 97.0% |
| Ecuadorians | 0.0 /100 | #303 | Tragic 96.9% |
| Immigrants | Caribbean | 0.0 /100 | #304 | Tragic 96.9% |
| Nicaraguans | 0.0 /100 | #305 | Tragic 96.9% |
| Immigrants | Somalia | 0.0 /100 | #306 | Tragic 96.9% |
| Immigrants | Azores | 0.0 /100 | #307 | Tragic 96.8% |
| Immigrants | Haiti | 0.0 /100 | #308 | Tragic 96.8% |
| Belizeans | 0.0 /100 | #309 | Tragic 96.8% |
| Sri Lankans | 0.0 /100 | #310 | Tragic 96.8% |
| Guyanese | 0.0 /100 | #311 | Tragic 96.8% |
| Cape Verdeans | 0.0 /100 | #312 | Tragic 96.8% |
| Hispanics or Latinos | 0.0 /100 | #313 | Tragic 96.8% |
| Immigrants | Ecuador | 0.0 /100 | #314 | Tragic 96.8% |
| Immigrants | Belize | 0.0 /100 | #315 | Tragic 96.8% |
Demographics Similar to Whites/Caucasians by 2nd Grade
In terms of 2nd grade, the demographic groups most similar to Whites/Caucasians are Celtic (98.4%, a difference of 0.0%), Estonian (98.4%, a difference of 0.0%), Australian (98.4%, a difference of 0.0%), Czechoslovakian (98.4%, a difference of 0.010%), and Pueblo (98.3%, a difference of 0.010%).
| Demographics | Rating | Rank | 2nd Grade |
| Belgians | 99.9 /100 | #43 | Exceptional 98.4% |
| Northern Europeans | 99.9 /100 | #44 | Exceptional 98.4% |
| Hungarians | 99.9 /100 | #45 | Exceptional 98.4% |
| Lumbee | 99.9 /100 | #46 | Exceptional 98.4% |
| Ottawa | 99.9 /100 | #47 | Exceptional 98.4% |
| Czechoslovakians | 99.9 /100 | #48 | Exceptional 98.4% |
| Celtics | 99.8 /100 | #49 | Exceptional 98.4% |
| Whites/Caucasians | 99.8 /100 | #50 | Exceptional 98.4% |
| Estonians | 99.8 /100 | #51 | Exceptional 98.4% |
| Australians | 99.8 /100 | #52 | Exceptional 98.4% |
| Pueblo | 99.8 /100 | #53 | Exceptional 98.3% |
| Kiowa | 99.8 /100 | #54 | Exceptional 98.3% |
| Immigrants | Scotland | 99.8 /100 | #55 | Exceptional 98.3% |
| Americans | 99.8 /100 | #56 | Exceptional 98.3% |
| Austrians | 99.8 /100 | #57 | Exceptional 98.3% |