Immigrants from Northern Europe vs Samoan Doctorate Degree
COMPARE
Immigrants from Northern Europe
Samoan
Doctorate Degree
Doctorate Degree Comparison
Immigrants from Northern Europe
Samoans
2.6%
DOCTORATE DEGREE
100.0/ 100
METRIC RATING
32nd/ 347
METRIC RANK
1.4%
DOCTORATE DEGREE
0.2/ 100
METRIC RATING
294th/ 347
METRIC RANK
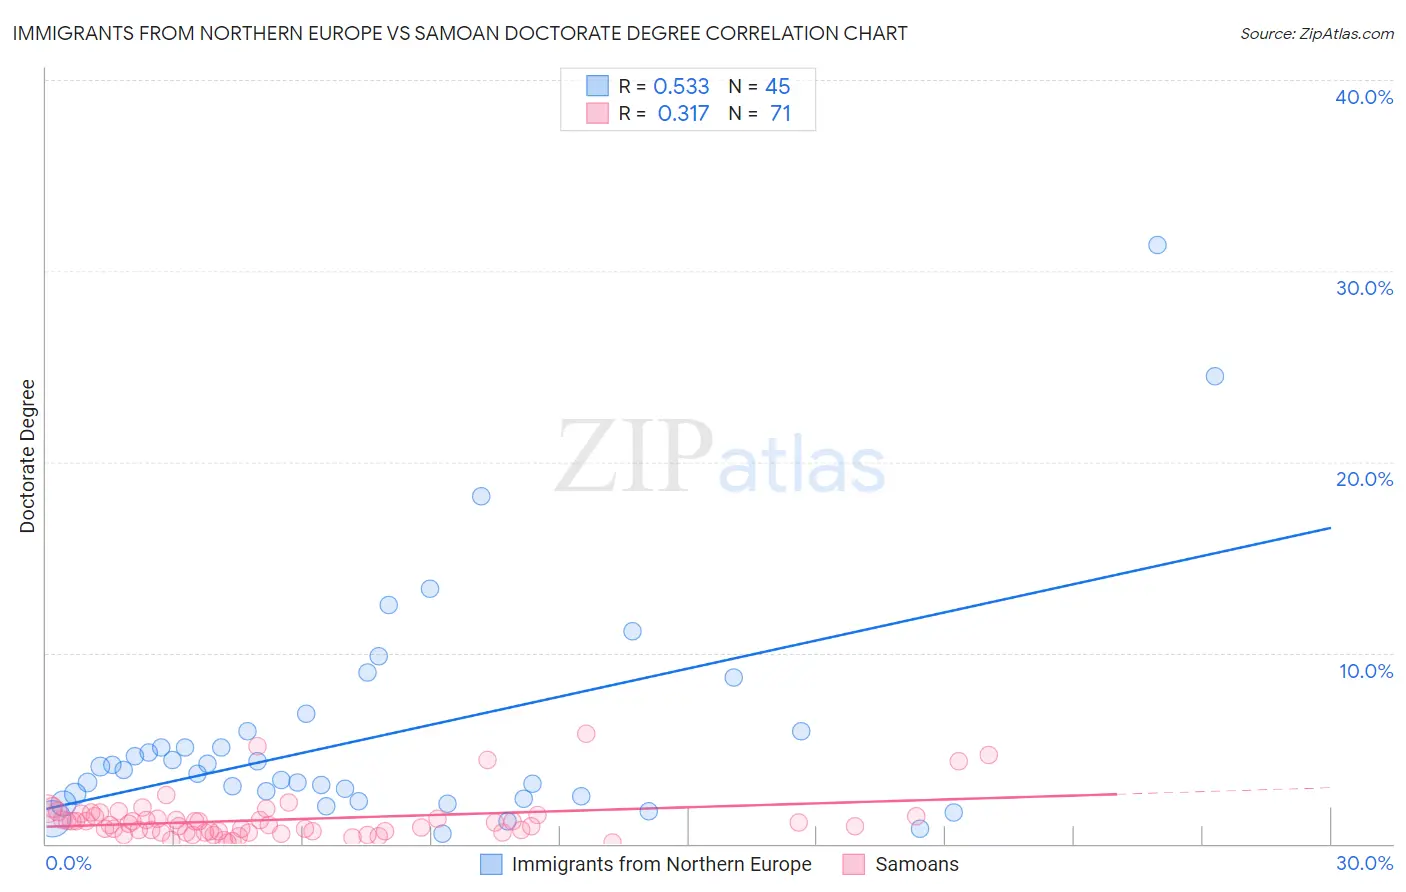
Immigrants from Northern Europe vs Samoan Doctorate Degree Correlation Chart
The statistical analysis conducted on geographies consisting of 470,866,361 people shows a substantial positive correlation between the proportion of Immigrants from Northern Europe and percentage of population with at least doctorate degree education in the United States with a correlation coefficient (R) of 0.533 and weighted average of 2.6%. Similarly, the statistical analysis conducted on geographies consisting of 223,690,736 people shows a mild positive correlation between the proportion of Samoans and percentage of population with at least doctorate degree education in the United States with a correlation coefficient (R) of 0.317 and weighted average of 1.4%, a difference of 81.0%.
Doctorate Degree Correlation Summary
| Measurement | Immigrants from Northern Europe | Samoan |
| Minimum | 0.53% | 0.079% |
| Maximum | 31.4% | 5.8% |
| Range | 30.8% | 5.7% |
| Mean | 5.7% | 1.3% |
| Median | 3.9% | 1.0% |
| Interquartile 25% (IQ1) | 2.4% | 0.61% |
| Interquartile 75% (IQ3) | 5.9% | 1.4% |
| Interquartile Range (IQR) | 3.4% | 0.83% |
| Standard Deviation (Sample) | 6.1% | 1.1% |
| Standard Deviation (Population) | 6.0% | 1.1% |
Similar Demographics by Doctorate Degree
Demographics Similar to Immigrants from Northern Europe by Doctorate Degree
In terms of doctorate degree, the demographic groups most similar to Immigrants from Northern Europe are Latvian (2.6%, a difference of 0.15%), Cambodian (2.6%, a difference of 0.17%), Cypriot (2.6%, a difference of 0.29%), Immigrants from Malaysia (2.6%, a difference of 0.35%), and Immigrants from Spain (2.6%, a difference of 0.41%).
| Demographics | Rating | Rank | Doctorate Degree |
| Immigrants | Saudi Arabia | 100.0 /100 | #25 | Exceptional 2.7% |
| Turks | 100.0 /100 | #26 | Exceptional 2.7% |
| Immigrants | Turkey | 100.0 /100 | #27 | Exceptional 2.6% |
| Burmese | 100.0 /100 | #28 | Exceptional 2.6% |
| Immigrants | South Central Asia | 100.0 /100 | #29 | Exceptional 2.6% |
| Immigrants | Korea | 100.0 /100 | #30 | Exceptional 2.6% |
| Latvians | 100.0 /100 | #31 | Exceptional 2.6% |
| Immigrants | Northern Europe | 100.0 /100 | #32 | Exceptional 2.6% |
| Cambodians | 100.0 /100 | #33 | Exceptional 2.6% |
| Cypriots | 100.0 /100 | #34 | Exceptional 2.6% |
| Immigrants | Malaysia | 100.0 /100 | #35 | Exceptional 2.6% |
| Immigrants | Spain | 100.0 /100 | #36 | Exceptional 2.6% |
| Immigrants | Kuwait | 100.0 /100 | #37 | Exceptional 2.6% |
| Russians | 100.0 /100 | #38 | Exceptional 2.6% |
| Immigrants | Ireland | 100.0 /100 | #39 | Exceptional 2.5% |
Demographics Similar to Samoans by Doctorate Degree
In terms of doctorate degree, the demographic groups most similar to Samoans are Guatemalan (1.4%, a difference of 0.70%), Immigrants from Yemen (1.4%, a difference of 0.71%), Immigrants from Ecuador (1.4%, a difference of 0.94%), Tsimshian (1.4%, a difference of 1.1%), and Alaska Native (1.4%, a difference of 1.3%).
| Demographics | Rating | Rank | Doctorate Degree |
| Cajuns | 0.3 /100 | #287 | Tragic 1.5% |
| Immigrants | El Salvador | 0.3 /100 | #288 | Tragic 1.4% |
| Cape Verdeans | 0.3 /100 | #289 | Tragic 1.4% |
| Choctaw | 0.3 /100 | #290 | Tragic 1.4% |
| Blacks/African Americans | 0.3 /100 | #291 | Tragic 1.4% |
| Alaska Natives | 0.3 /100 | #292 | Tragic 1.4% |
| Immigrants | Yemen | 0.2 /100 | #293 | Tragic 1.4% |
| Samoans | 0.2 /100 | #294 | Tragic 1.4% |
| Guatemalans | 0.2 /100 | #295 | Tragic 1.4% |
| Immigrants | Ecuador | 0.2 /100 | #296 | Tragic 1.4% |
| Tsimshian | 0.2 /100 | #297 | Tragic 1.4% |
| Puerto Ricans | 0.1 /100 | #298 | Tragic 1.4% |
| Belizeans | 0.1 /100 | #299 | Tragic 1.4% |
| Immigrants | Guatemala | 0.1 /100 | #300 | Tragic 1.4% |
| Hondurans | 0.1 /100 | #301 | Tragic 1.4% |