Immigrants from Cameroon vs Pennsylvania German 7th Grade
COMPARE
Immigrants from Cameroon
Pennsylvania German
7th Grade
7th Grade Comparison
Immigrants from Cameroon
Pennsylvania Germans
95.4%
7TH GRADE
0.9/ 100
METRIC RATING
250th/ 347
METRIC RANK
97.6%
7TH GRADE
100.0/ 100
METRIC RATING
14th/ 347
METRIC RANK
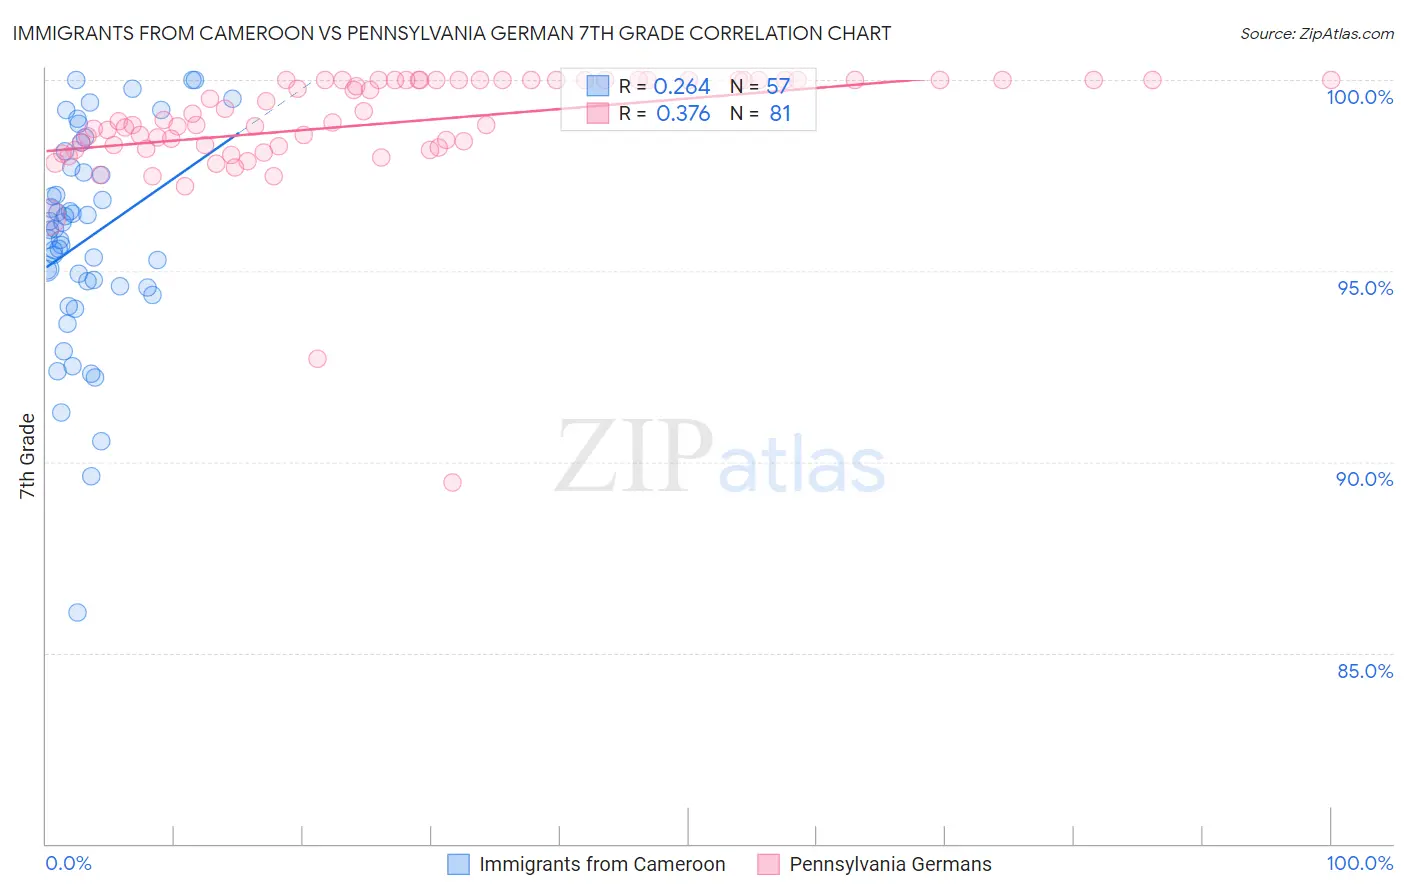
Immigrants from Cameroon vs Pennsylvania German 7th Grade Correlation Chart
The statistical analysis conducted on geographies consisting of 130,618,704 people shows a weak positive correlation between the proportion of Immigrants from Cameroon and percentage of population with at least 7th grade education in the United States with a correlation coefficient (R) of 0.264 and weighted average of 95.4%. Similarly, the statistical analysis conducted on geographies consisting of 234,102,588 people shows a mild positive correlation between the proportion of Pennsylvania Germans and percentage of population with at least 7th grade education in the United States with a correlation coefficient (R) of 0.376 and weighted average of 97.6%, a difference of 2.4%.
7th Grade Correlation Summary
| Measurement | Immigrants from Cameroon | Pennsylvania German |
| Minimum | 86.1% | 89.5% |
| Maximum | 100.0% | 100.0% |
| Range | 13.9% | 10.5% |
| Mean | 95.8% | 98.9% |
| Median | 96.1% | 98.9% |
| Interquartile 25% (IQ1) | 94.6% | 98.2% |
| Interquartile 75% (IQ3) | 97.6% | 100.0% |
| Interquartile Range (IQR) | 3.1% | 1.8% |
| Standard Deviation (Sample) | 2.8% | 1.6% |
| Standard Deviation (Population) | 2.8% | 1.6% |
Similar Demographics by 7th Grade
Demographics Similar to Immigrants from Cameroon by 7th Grade
In terms of 7th grade, the demographic groups most similar to Immigrants from Cameroon are Immigrants from Jamaica (95.4%, a difference of 0.0%), Immigrants from Ethiopia (95.3%, a difference of 0.0%), Somali (95.3%, a difference of 0.010%), Bolivian (95.4%, a difference of 0.020%), and Colombian (95.3%, a difference of 0.020%).
| Demographics | Rating | Rank | 7th Grade |
| U.S. Virgin Islanders | 1.6 /100 | #243 | Tragic 95.4% |
| Uruguayans | 1.6 /100 | #244 | Tragic 95.4% |
| Immigrants | Middle Africa | 1.5 /100 | #245 | Tragic 95.4% |
| Ethiopians | 1.5 /100 | #246 | Tragic 95.4% |
| Tongans | 1.3 /100 | #247 | Tragic 95.4% |
| Paiute | 1.2 /100 | #248 | Tragic 95.4% |
| Bolivians | 1.1 /100 | #249 | Tragic 95.4% |
| Immigrants | Cameroon | 0.9 /100 | #250 | Tragic 95.4% |
| Immigrants | Jamaica | 0.9 /100 | #251 | Tragic 95.4% |
| Immigrants | Ethiopia | 0.9 /100 | #252 | Tragic 95.3% |
| Somalis | 0.9 /100 | #253 | Tragic 95.3% |
| Colombians | 0.8 /100 | #254 | Tragic 95.3% |
| Koreans | 0.8 /100 | #255 | Tragic 95.3% |
| Immigrants | China | 0.7 /100 | #256 | Tragic 95.3% |
| Immigrants | Congo | 0.7 /100 | #257 | Tragic 95.3% |
Demographics Similar to Pennsylvania Germans by 7th Grade
In terms of 7th grade, the demographic groups most similar to Pennsylvania Germans are Swedish (97.6%, a difference of 0.010%), English (97.6%, a difference of 0.010%), Polish (97.6%, a difference of 0.040%), Alaskan Athabascan (97.6%, a difference of 0.050%), and Slovene (97.6%, a difference of 0.060%).
| Demographics | Rating | Rank | 7th Grade |
| Norwegians | 100.0 /100 | #7 | Exceptional 97.8% |
| Slovaks | 100.0 /100 | #8 | Exceptional 97.8% |
| Germans | 100.0 /100 | #9 | Exceptional 97.7% |
| Slovenes | 100.0 /100 | #10 | Exceptional 97.6% |
| Alaskan Athabascans | 100.0 /100 | #11 | Exceptional 97.6% |
| Poles | 100.0 /100 | #12 | Exceptional 97.6% |
| Swedes | 100.0 /100 | #13 | Exceptional 97.6% |
| Pennsylvania Germans | 100.0 /100 | #14 | Exceptional 97.6% |
| English | 100.0 /100 | #15 | Exceptional 97.6% |
| Irish | 100.0 /100 | #16 | Exceptional 97.5% |
| Scottish | 100.0 /100 | #17 | Exceptional 97.5% |
| Tlingit-Haida | 100.0 /100 | #18 | Exceptional 97.5% |
| Lithuanians | 100.0 /100 | #19 | Exceptional 97.5% |
| Yup'ik | 100.0 /100 | #20 | Exceptional 97.4% |
| Inupiat | 100.0 /100 | #21 | Exceptional 97.4% |