Immigrants from Guatemala vs Pennsylvania German 7th Grade
COMPARE
Immigrants from Guatemala
Pennsylvania German
7th Grade
7th Grade Comparison
Immigrants from Guatemala
Pennsylvania Germans
91.3%
7TH GRADE
0.0/ 100
METRIC RATING
343rd/ 347
METRIC RANK
97.6%
7TH GRADE
100.0/ 100
METRIC RATING
14th/ 347
METRIC RANK
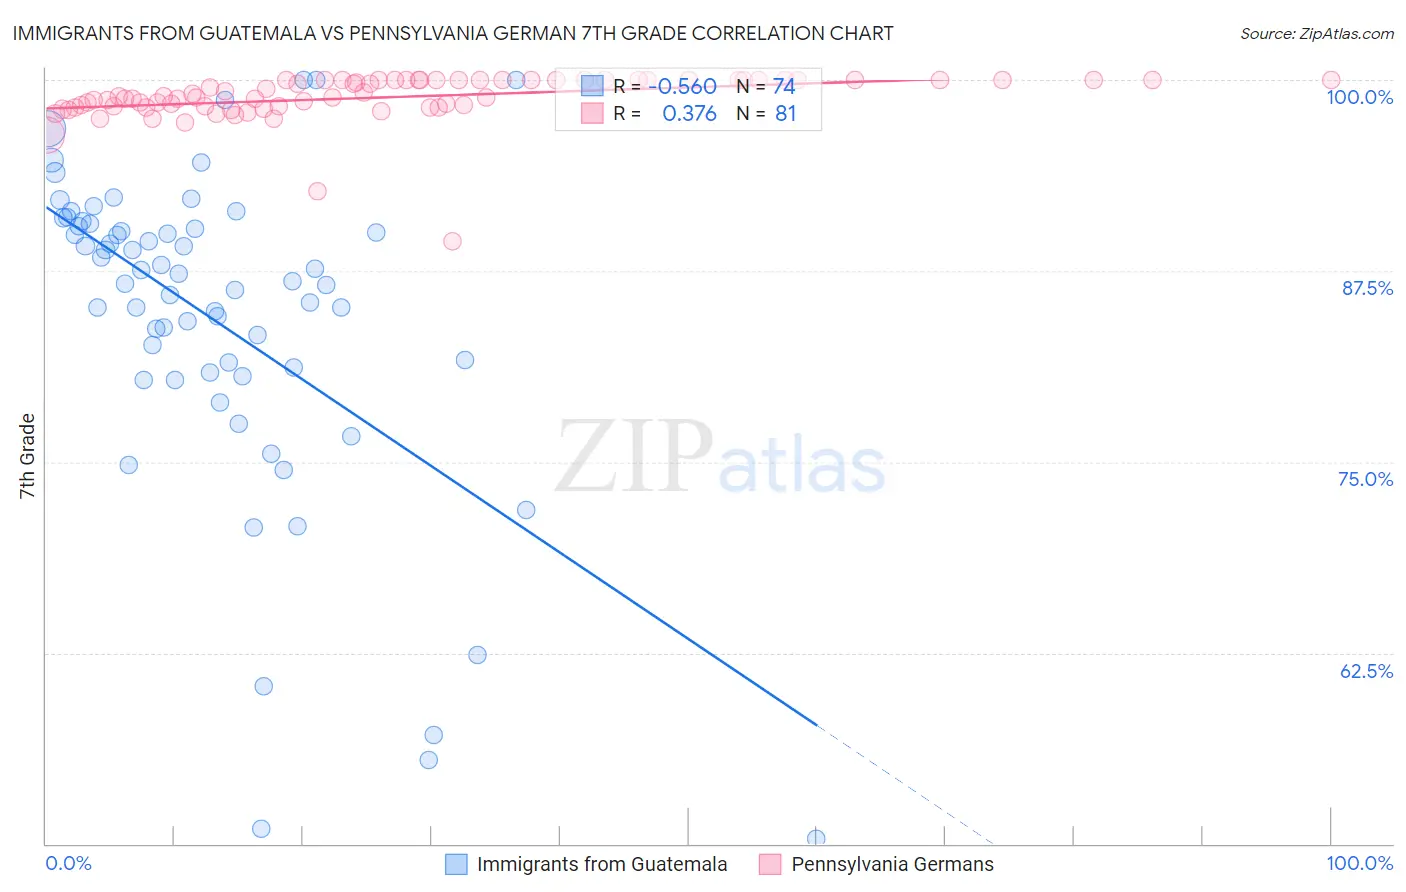
Immigrants from Guatemala vs Pennsylvania German 7th Grade Correlation Chart
The statistical analysis conducted on geographies consisting of 377,286,142 people shows a substantial negative correlation between the proportion of Immigrants from Guatemala and percentage of population with at least 7th grade education in the United States with a correlation coefficient (R) of -0.560 and weighted average of 91.3%. Similarly, the statistical analysis conducted on geographies consisting of 234,102,588 people shows a mild positive correlation between the proportion of Pennsylvania Germans and percentage of population with at least 7th grade education in the United States with a correlation coefficient (R) of 0.376 and weighted average of 97.6%, a difference of 6.9%.
7th Grade Correlation Summary
| Measurement | Immigrants from Guatemala | Pennsylvania German |
| Minimum | 50.3% | 89.5% |
| Maximum | 100.0% | 100.0% |
| Range | 49.7% | 10.5% |
| Mean | 84.2% | 98.9% |
| Median | 86.7% | 98.9% |
| Interquartile 25% (IQ1) | 80.8% | 98.2% |
| Interquartile 75% (IQ3) | 90.5% | 100.0% |
| Interquartile Range (IQR) | 9.6% | 1.8% |
| Standard Deviation (Sample) | 10.7% | 1.6% |
| Standard Deviation (Population) | 10.6% | 1.6% |
Similar Demographics by 7th Grade
Demographics Similar to Immigrants from Guatemala by 7th Grade
In terms of 7th grade, the demographic groups most similar to Immigrants from Guatemala are Salvadoran (91.5%, a difference of 0.16%), Immigrants from Central America (91.0%, a difference of 0.36%), Guatemalan (91.7%, a difference of 0.43%), Immigrants from El Salvador (90.9%, a difference of 0.43%), and Yakama (91.7%, a difference of 0.45%).
| Demographics | Rating | Rank | 7th Grade |
| Immigrants | Armenia | 0.0 /100 | #333 | Tragic 92.7% |
| Immigrants | Yemen | 0.0 /100 | #334 | Tragic 92.6% |
| Mexican American Indians | 0.0 /100 | #335 | Tragic 92.6% |
| Immigrants | Honduras | 0.0 /100 | #336 | Tragic 92.5% |
| Immigrants | Latin America | 0.0 /100 | #337 | Tragic 92.2% |
| Central Americans | 0.0 /100 | #338 | Tragic 92.1% |
| Mexicans | 0.0 /100 | #339 | Tragic 91.9% |
| Yakama | 0.0 /100 | #340 | Tragic 91.7% |
| Guatemalans | 0.0 /100 | #341 | Tragic 91.7% |
| Salvadorans | 0.0 /100 | #342 | Tragic 91.5% |
| Immigrants | Guatemala | 0.0 /100 | #343 | Tragic 91.3% |
| Immigrants | Central America | 0.0 /100 | #344 | Tragic 91.0% |
| Immigrants | El Salvador | 0.0 /100 | #345 | Tragic 90.9% |
| Immigrants | Mexico | 0.0 /100 | #346 | Tragic 90.7% |
| Spanish American Indians | 0.0 /100 | #347 | Tragic 90.3% |
Demographics Similar to Pennsylvania Germans by 7th Grade
In terms of 7th grade, the demographic groups most similar to Pennsylvania Germans are Swedish (97.6%, a difference of 0.010%), English (97.6%, a difference of 0.010%), Polish (97.6%, a difference of 0.040%), Alaskan Athabascan (97.6%, a difference of 0.050%), and Slovene (97.6%, a difference of 0.060%).
| Demographics | Rating | Rank | 7th Grade |
| Norwegians | 100.0 /100 | #7 | Exceptional 97.8% |
| Slovaks | 100.0 /100 | #8 | Exceptional 97.8% |
| Germans | 100.0 /100 | #9 | Exceptional 97.7% |
| Slovenes | 100.0 /100 | #10 | Exceptional 97.6% |
| Alaskan Athabascans | 100.0 /100 | #11 | Exceptional 97.6% |
| Poles | 100.0 /100 | #12 | Exceptional 97.6% |
| Swedes | 100.0 /100 | #13 | Exceptional 97.6% |
| Pennsylvania Germans | 100.0 /100 | #14 | Exceptional 97.6% |
| English | 100.0 /100 | #15 | Exceptional 97.6% |
| Irish | 100.0 /100 | #16 | Exceptional 97.5% |
| Scottish | 100.0 /100 | #17 | Exceptional 97.5% |
| Tlingit-Haida | 100.0 /100 | #18 | Exceptional 97.5% |
| Lithuanians | 100.0 /100 | #19 | Exceptional 97.5% |
| Yup'ik | 100.0 /100 | #20 | Exceptional 97.4% |
| Inupiat | 100.0 /100 | #21 | Exceptional 97.4% |