Immigrants from Haiti vs Immigrants from North America Unemployment Among Ages 16 to 19 years
COMPARE
Immigrants from Haiti
Immigrants from North America
Unemployment Among Ages 16 to 19 years
Unemployment Among Ages 16 to 19 years Comparison
Immigrants from Haiti
Immigrants from North America
20.4%
UNEMPLOYMENT AMONG AGES 16 TO 19 YEARS
0.0/ 100
METRIC RATING
294th/ 347
METRIC RANK
16.8%
UNEMPLOYMENT AMONG AGES 16 TO 19 YEARS
97.9/ 100
METRIC RATING
76th/ 347
METRIC RANK
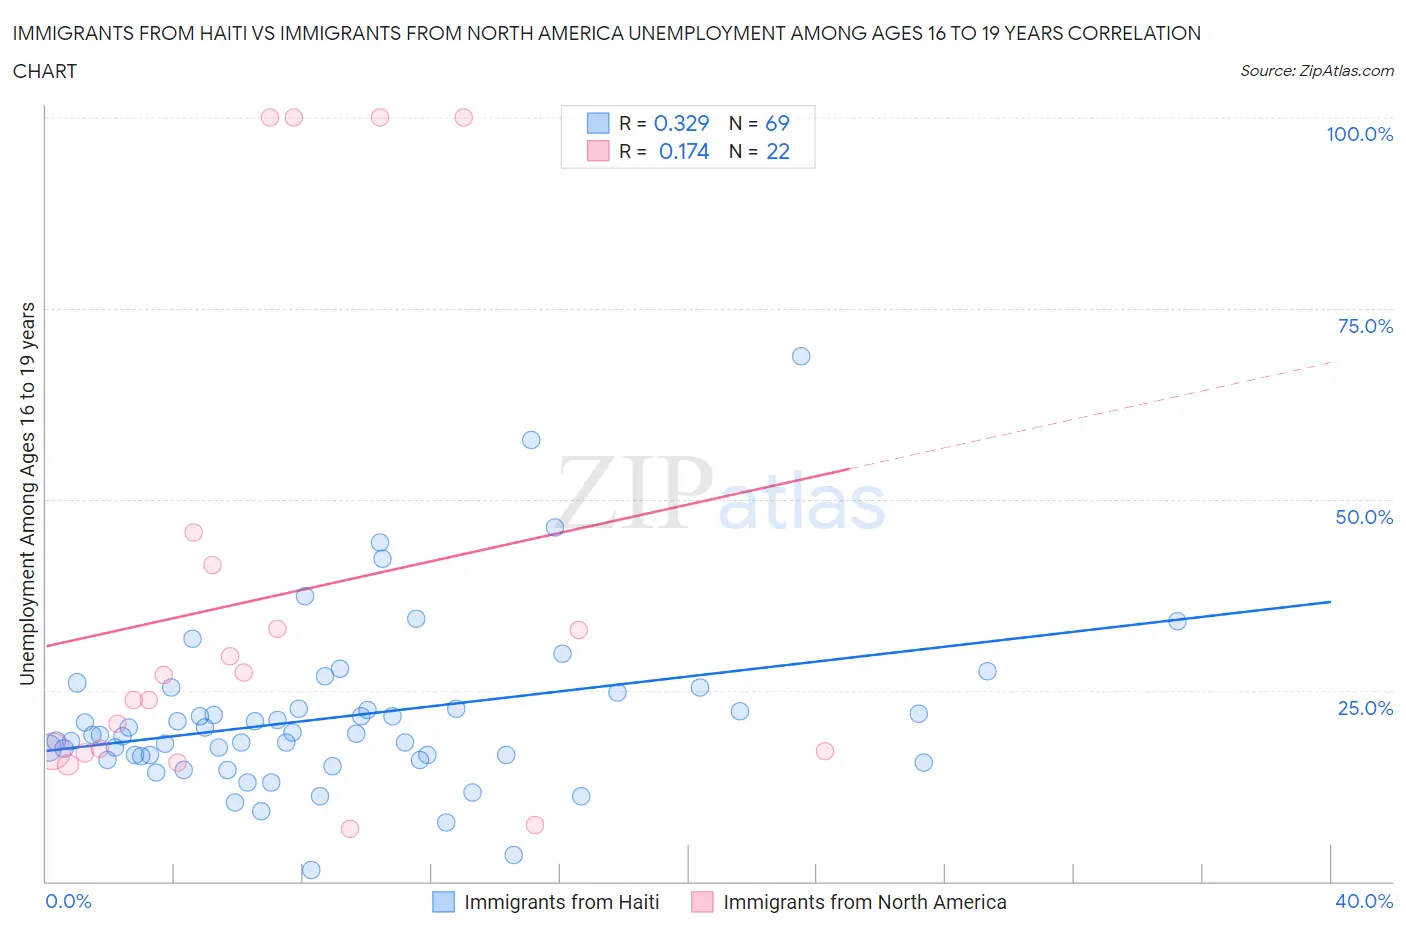
Immigrants from Haiti vs Immigrants from North America Unemployment Among Ages 16 to 19 years Correlation Chart
The statistical analysis conducted on geographies consisting of 217,842,673 people shows a mild positive correlation between the proportion of Immigrants from Haiti and unemployment rate among population between the ages 16 and 19 in the United States with a correlation coefficient (R) of 0.329 and weighted average of 20.4%. Similarly, the statistical analysis conducted on geographies consisting of 431,170,215 people shows a poor positive correlation between the proportion of Immigrants from North America and unemployment rate among population between the ages 16 and 19 in the United States with a correlation coefficient (R) of 0.174 and weighted average of 16.8%, a difference of 21.8%.
Unemployment Among Ages 16 to 19 years Correlation Summary
| Measurement | Immigrants from Haiti | Immigrants from North America |
| Minimum | 1.4% | 6.9% |
| Maximum | 68.8% | 100.0% |
| Range | 67.4% | 93.1% |
| Mean | 21.6% | 37.2% |
| Median | 19.1% | 25.4% |
| Interquartile 25% (IQ1) | 16.1% | 17.0% |
| Interquartile 75% (IQ3) | 23.7% | 41.4% |
| Interquartile Range (IQR) | 7.5% | 24.4% |
| Standard Deviation (Sample) | 11.0% | 31.8% |
| Standard Deviation (Population) | 10.9% | 31.0% |
Similar Demographics by Unemployment Among Ages 16 to 19 years
Demographics Similar to Immigrants from Haiti by Unemployment Among Ages 16 to 19 years
In terms of unemployment among ages 16 to 19 years, the demographic groups most similar to Immigrants from Haiti are Central American Indian (20.4%, a difference of 0.060%), Immigrants from Bahamas (20.4%, a difference of 0.26%), Armenian (20.5%, a difference of 0.35%), Alsatian (20.5%, a difference of 0.38%), and Haitian (20.5%, a difference of 0.43%).
| Demographics | Rating | Rank | Unemployment Among Ages 16 to 19 years |
| Immigrants | Ghana | 0.0 /100 | #287 | Tragic 19.8% |
| Immigrants | Azores | 0.0 /100 | #288 | Tragic 19.8% |
| Pueblo | 0.0 /100 | #289 | Tragic 19.8% |
| Immigrants | Sierra Leone | 0.0 /100 | #290 | Tragic 20.0% |
| Immigrants | Yemen | 0.0 /100 | #291 | Tragic 20.0% |
| Comanche | 0.0 /100 | #292 | Tragic 20.2% |
| Immigrants | Bahamas | 0.0 /100 | #293 | Tragic 20.4% |
| Immigrants | Haiti | 0.0 /100 | #294 | Tragic 20.4% |
| Central American Indians | 0.0 /100 | #295 | Tragic 20.4% |
| Armenians | 0.0 /100 | #296 | Tragic 20.5% |
| Alsatians | 0.0 /100 | #297 | Tragic 20.5% |
| Haitians | 0.0 /100 | #298 | Tragic 20.5% |
| Immigrants | Uzbekistan | 0.0 /100 | #299 | Tragic 20.5% |
| Ecuadorians | 0.0 /100 | #300 | Tragic 20.5% |
| Immigrants | Ecuador | 0.0 /100 | #301 | Tragic 20.9% |
Demographics Similar to Immigrants from North America by Unemployment Among Ages 16 to 19 years
In terms of unemployment among ages 16 to 19 years, the demographic groups most similar to Immigrants from North America are New Zealander (16.8%, a difference of 0.070%), Immigrants from Singapore (16.8%, a difference of 0.070%), Soviet Union (16.8%, a difference of 0.090%), Immigrants from Eastern Africa (16.8%, a difference of 0.13%), and Lithuanian (16.7%, a difference of 0.16%).
| Demographics | Rating | Rank | Unemployment Among Ages 16 to 19 years |
| Serbians | 98.7 /100 | #69 | Exceptional 16.7% |
| Austrians | 98.6 /100 | #70 | Exceptional 16.7% |
| Latvians | 98.5 /100 | #71 | Exceptional 16.7% |
| Immigrants | Canada | 98.5 /100 | #72 | Exceptional 16.7% |
| Lithuanians | 98.2 /100 | #73 | Exceptional 16.7% |
| Immigrants | Eastern Africa | 98.1 /100 | #74 | Exceptional 16.8% |
| New Zealanders | 98.0 /100 | #75 | Exceptional 16.8% |
| Immigrants | North America | 97.9 /100 | #76 | Exceptional 16.8% |
| Immigrants | Singapore | 97.8 /100 | #77 | Exceptional 16.8% |
| Soviet Union | 97.8 /100 | #78 | Exceptional 16.8% |
| Slovaks | 97.5 /100 | #79 | Exceptional 16.8% |
| French Canadians | 97.5 /100 | #80 | Exceptional 16.8% |
| Immigrants | Latvia | 97.5 /100 | #81 | Exceptional 16.8% |
| Whites/Caucasians | 97.5 /100 | #82 | Exceptional 16.8% |
| Ugandans | 97.4 /100 | #83 | Exceptional 16.8% |