Immigrants from Haiti vs Navajo Nursery School
COMPARE
Immigrants from Haiti
Navajo
Nursery School
Nursery School Comparison
Immigrants from Haiti
Navajo
97.0%
NURSERY SCHOOL
0.0/ 100
METRIC RATING
308th/ 347
METRIC RANK
98.0%
NURSERY SCHOOL
50.0/ 100
METRIC RATING
174th/ 347
METRIC RANK
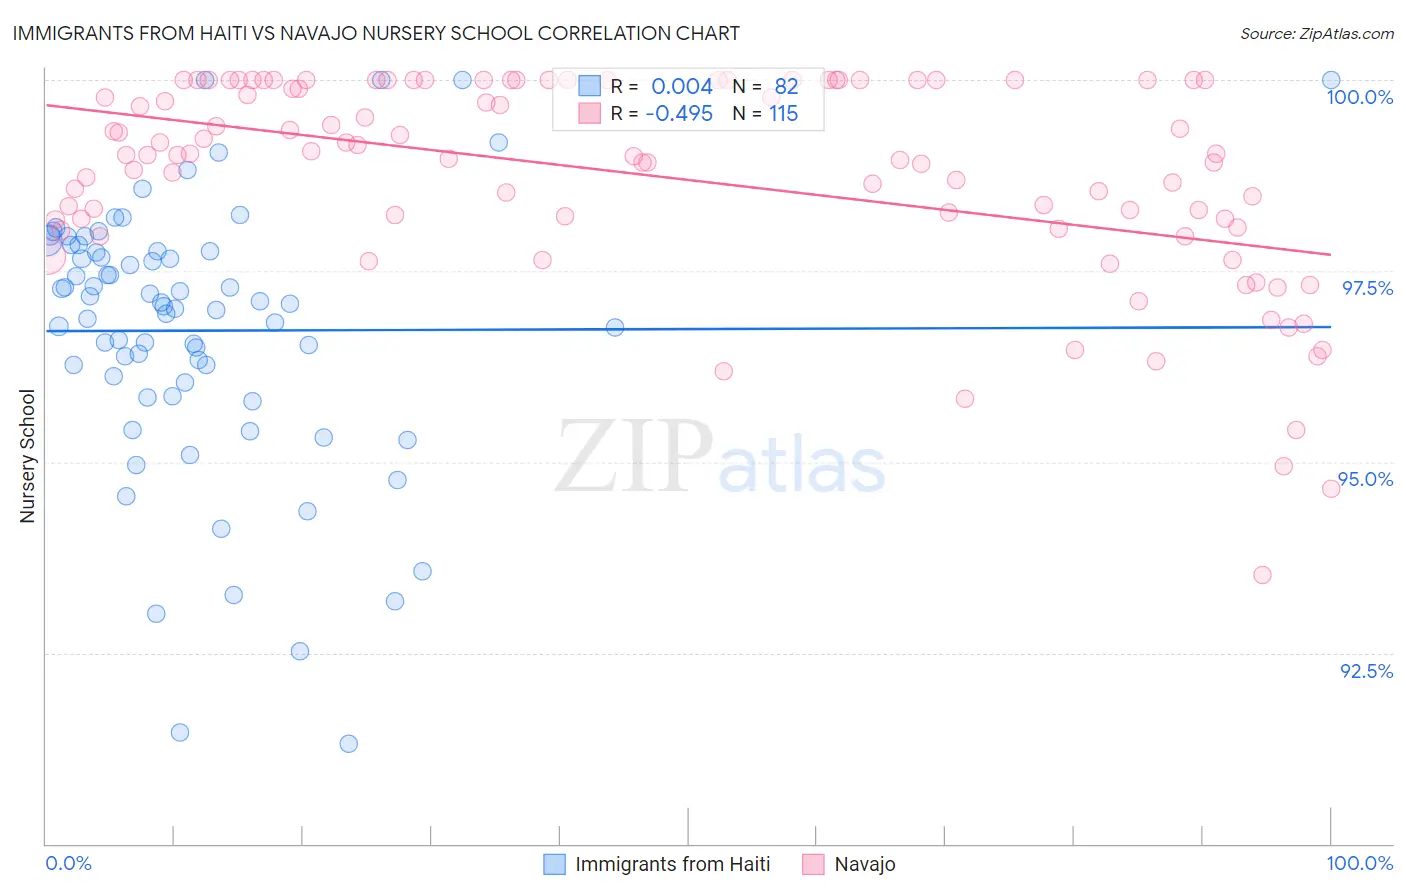
Immigrants from Haiti vs Navajo Nursery School Correlation Chart
The statistical analysis conducted on geographies consisting of 225,286,614 people shows no correlation between the proportion of Immigrants from Haiti and percentage of population with at least nursery school education in the United States with a correlation coefficient (R) of 0.004 and weighted average of 97.0%. Similarly, the statistical analysis conducted on geographies consisting of 224,872,493 people shows a moderate negative correlation between the proportion of Navajo and percentage of population with at least nursery school education in the United States with a correlation coefficient (R) of -0.495 and weighted average of 98.0%, a difference of 1.0%.
Nursery School Correlation Summary
| Measurement | Immigrants from Haiti | Navajo |
| Minimum | 91.3% | 93.5% |
| Maximum | 100.0% | 100.0% |
| Range | 8.7% | 6.5% |
| Mean | 96.7% | 98.7% |
| Median | 97.1% | 99.0% |
| Interquartile 25% (IQ1) | 96.0% | 98.2% |
| Interquartile 75% (IQ3) | 97.8% | 100.0% |
| Interquartile Range (IQR) | 1.7% | 1.8% |
| Standard Deviation (Sample) | 1.8% | 1.3% |
| Standard Deviation (Population) | 1.8% | 1.3% |
Similar Demographics by Nursery School
Demographics Similar to Immigrants from Haiti by Nursery School
In terms of nursery school, the demographic groups most similar to Immigrants from Haiti are Hispanic or Latino (97.0%, a difference of 0.0%), Belizean (97.0%, a difference of 0.010%), Immigrants from Somalia (97.0%, a difference of 0.010%), Guyanese (97.0%, a difference of 0.030%), and Immigrants from the Azores (97.0%, a difference of 0.030%).
| Demographics | Rating | Rank | Nursery School |
| Immigrants | South Eastern Asia | 0.0 /100 | #301 | Tragic 97.1% |
| Immigrants | Caribbean | 0.0 /100 | #302 | Tragic 97.1% |
| Nicaraguans | 0.0 /100 | #303 | Tragic 97.1% |
| Ecuadorians | 0.0 /100 | #304 | Tragic 97.1% |
| Somalis | 0.0 /100 | #305 | Tragic 97.1% |
| Belizeans | 0.0 /100 | #306 | Tragic 97.0% |
| Hispanics or Latinos | 0.0 /100 | #307 | Tragic 97.0% |
| Immigrants | Haiti | 0.0 /100 | #308 | Tragic 97.0% |
| Immigrants | Somalia | 0.0 /100 | #309 | Tragic 97.0% |
| Guyanese | 0.0 /100 | #310 | Tragic 97.0% |
| Immigrants | Azores | 0.0 /100 | #311 | Tragic 97.0% |
| Sri Lankans | 0.0 /100 | #312 | Tragic 97.0% |
| Hondurans | 0.0 /100 | #313 | Tragic 97.0% |
| Cape Verdeans | 0.0 /100 | #314 | Tragic 97.0% |
| Immigrants | Nicaragua | 0.0 /100 | #315 | Tragic 96.9% |
Demographics Similar to Navajo by Nursery School
In terms of nursery school, the demographic groups most similar to Navajo are Immigrants from Brazil (98.0%, a difference of 0.0%), Kenyan (98.0%, a difference of 0.0%), Immigrants from Sri Lanka (98.0%, a difference of 0.0%), Immigrants from Venezuela (98.0%, a difference of 0.0%), and Albanian (98.0%, a difference of 0.0%).
| Demographics | Rating | Rank | Nursery School |
| Immigrants | Spain | 55.6 /100 | #167 | Average 98.0% |
| Immigrants | Micronesia | 55.0 /100 | #168 | Average 98.0% |
| Immigrants | Korea | 53.8 /100 | #169 | Average 98.0% |
| Bermudans | 53.7 /100 | #170 | Average 98.0% |
| Immigrants | Jordan | 53.4 /100 | #171 | Average 98.0% |
| Immigrants | Brazil | 51.3 /100 | #172 | Average 98.0% |
| Kenyans | 50.2 /100 | #173 | Average 98.0% |
| Navajo | 50.0 /100 | #174 | Average 98.0% |
| Immigrants | Sri Lanka | 49.9 /100 | #175 | Average 98.0% |
| Immigrants | Venezuela | 49.8 /100 | #176 | Average 98.0% |
| Albanians | 48.9 /100 | #177 | Average 98.0% |
| Natives/Alaskans | 48.6 /100 | #178 | Average 98.0% |
| Argentineans | 46.8 /100 | #179 | Average 98.0% |
| Immigrants | Bosnia and Herzegovina | 45.6 /100 | #180 | Average 98.0% |
| Egyptians | 42.8 /100 | #181 | Average 98.0% |