Immigrants from Haiti vs Bahamian Nursery School
COMPARE
Immigrants from Haiti
Bahamian
Nursery School
Nursery School Comparison
Immigrants from Haiti
Bahamians
97.0%
NURSERY SCHOOL
0.0/ 100
METRIC RATING
308th/ 347
METRIC RANK
97.8%
NURSERY SCHOOL
7.4/ 100
METRIC RATING
215th/ 347
METRIC RANK
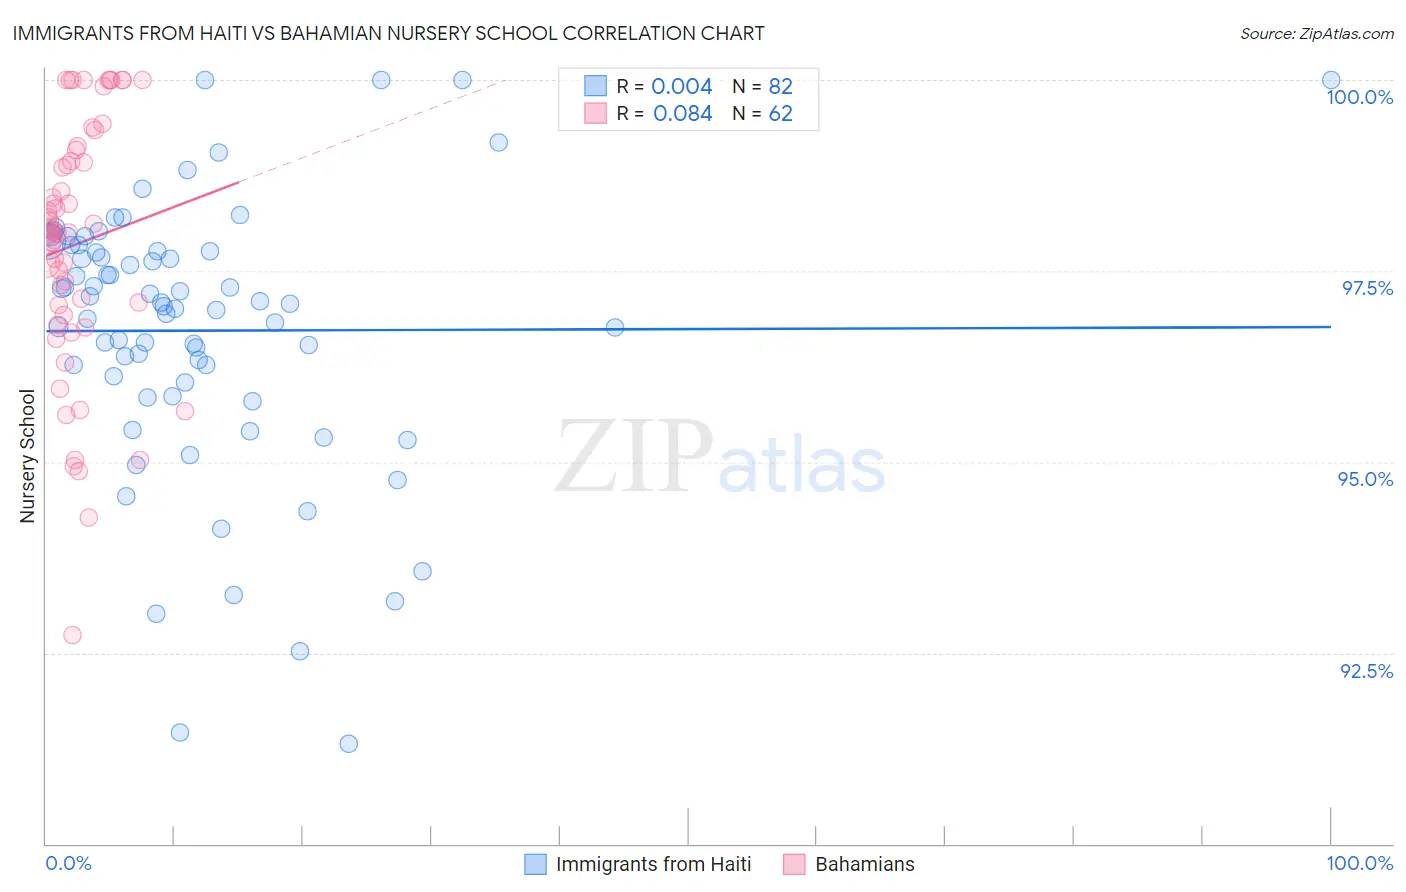
Immigrants from Haiti vs Bahamian Nursery School Correlation Chart
The statistical analysis conducted on geographies consisting of 225,286,614 people shows no correlation between the proportion of Immigrants from Haiti and percentage of population with at least nursery school education in the United States with a correlation coefficient (R) of 0.004 and weighted average of 97.0%. Similarly, the statistical analysis conducted on geographies consisting of 112,673,855 people shows a slight positive correlation between the proportion of Bahamians and percentage of population with at least nursery school education in the United States with a correlation coefficient (R) of 0.084 and weighted average of 97.8%, a difference of 0.81%.
Nursery School Correlation Summary
| Measurement | Immigrants from Haiti | Bahamian |
| Minimum | 91.3% | 92.7% |
| Maximum | 100.0% | 100.0% |
| Range | 8.7% | 7.3% |
| Mean | 96.7% | 97.9% |
| Median | 97.1% | 98.0% |
| Interquartile 25% (IQ1) | 96.0% | 96.9% |
| Interquartile 75% (IQ3) | 97.8% | 99.1% |
| Interquartile Range (IQR) | 1.7% | 2.2% |
| Standard Deviation (Sample) | 1.8% | 1.7% |
| Standard Deviation (Population) | 1.8% | 1.6% |
Similar Demographics by Nursery School
Demographics Similar to Immigrants from Haiti by Nursery School
In terms of nursery school, the demographic groups most similar to Immigrants from Haiti are Hispanic or Latino (97.0%, a difference of 0.0%), Belizean (97.0%, a difference of 0.010%), Immigrants from Somalia (97.0%, a difference of 0.010%), Guyanese (97.0%, a difference of 0.030%), and Immigrants from the Azores (97.0%, a difference of 0.030%).
| Demographics | Rating | Rank | Nursery School |
| Immigrants | South Eastern Asia | 0.0 /100 | #301 | Tragic 97.1% |
| Immigrants | Caribbean | 0.0 /100 | #302 | Tragic 97.1% |
| Nicaraguans | 0.0 /100 | #303 | Tragic 97.1% |
| Ecuadorians | 0.0 /100 | #304 | Tragic 97.1% |
| Somalis | 0.0 /100 | #305 | Tragic 97.1% |
| Belizeans | 0.0 /100 | #306 | Tragic 97.0% |
| Hispanics or Latinos | 0.0 /100 | #307 | Tragic 97.0% |
| Immigrants | Haiti | 0.0 /100 | #308 | Tragic 97.0% |
| Immigrants | Somalia | 0.0 /100 | #309 | Tragic 97.0% |
| Guyanese | 0.0 /100 | #310 | Tragic 97.0% |
| Immigrants | Azores | 0.0 /100 | #311 | Tragic 97.0% |
| Sri Lankans | 0.0 /100 | #312 | Tragic 97.0% |
| Hondurans | 0.0 /100 | #313 | Tragic 97.0% |
| Cape Verdeans | 0.0 /100 | #314 | Tragic 97.0% |
| Immigrants | Nicaragua | 0.0 /100 | #315 | Tragic 96.9% |
Demographics Similar to Bahamians by Nursery School
In terms of nursery school, the demographic groups most similar to Bahamians are Uruguayan (97.8%, a difference of 0.0%), Immigrants from Bahamas (97.8%, a difference of 0.010%), Moroccan (97.8%, a difference of 0.010%), South American Indian (97.8%, a difference of 0.010%), and Samoan (97.8%, a difference of 0.010%).
| Demographics | Rating | Rank | Nursery School |
| Immigrants | Northern Africa | 11.7 /100 | #208 | Poor 97.8% |
| Costa Ricans | 11.3 /100 | #209 | Poor 97.8% |
| Immigrants | Oceania | 10.2 /100 | #210 | Poor 97.8% |
| Laotians | 9.8 /100 | #211 | Tragic 97.8% |
| Immigrants | Bahamas | 8.6 /100 | #212 | Tragic 97.8% |
| Moroccans | 8.3 /100 | #213 | Tragic 97.8% |
| South American Indians | 8.0 /100 | #214 | Tragic 97.8% |
| Bahamians | 7.4 /100 | #215 | Tragic 97.8% |
| Uruguayans | 7.1 /100 | #216 | Tragic 97.8% |
| Samoans | 6.3 /100 | #217 | Tragic 97.8% |
| Immigrants | Panama | 5.3 /100 | #218 | Tragic 97.8% |
| Immigrants | Morocco | 5.1 /100 | #219 | Tragic 97.8% |
| Immigrants | Zaire | 4.4 /100 | #220 | Tragic 97.8% |
| Tongans | 4.3 /100 | #221 | Tragic 97.8% |
| Immigrants | Syria | 4.0 /100 | #222 | Tragic 97.7% |