Immigrants from Sudan vs Chippewa 11th Grade
COMPARE
Immigrants from Sudan
Chippewa
11th Grade
11th Grade Comparison
Immigrants from Sudan
Chippewa
92.3%
11TH GRADE
23.5/ 100
METRIC RATING
203rd/ 347
METRIC RANK
93.5%
11TH GRADE
98.6/ 100
METRIC RATING
102nd/ 347
METRIC RANK
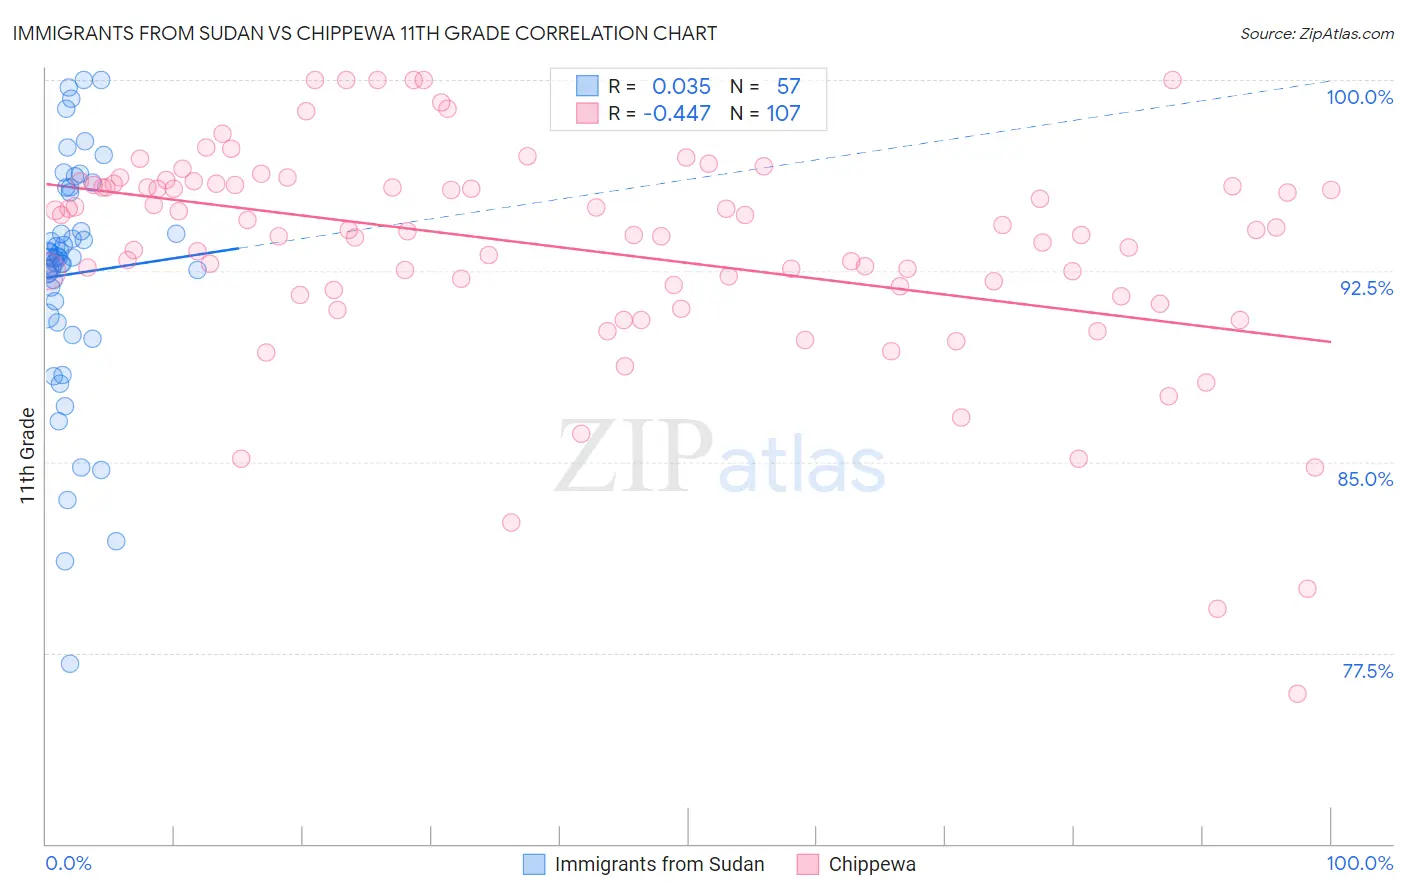
Immigrants from Sudan vs Chippewa 11th Grade Correlation Chart
The statistical analysis conducted on geographies consisting of 118,959,807 people shows no correlation between the proportion of Immigrants from Sudan and percentage of population with at least 11th grade education in the United States with a correlation coefficient (R) of 0.035 and weighted average of 92.3%. Similarly, the statistical analysis conducted on geographies consisting of 215,068,316 people shows a moderate negative correlation between the proportion of Chippewa and percentage of population with at least 11th grade education in the United States with a correlation coefficient (R) of -0.447 and weighted average of 93.5%, a difference of 1.3%.
11th Grade Correlation Summary
| Measurement | Immigrants from Sudan | Chippewa |
| Minimum | 77.1% | 75.9% |
| Maximum | 100.0% | 100.0% |
| Range | 22.9% | 24.1% |
| Mean | 92.4% | 93.4% |
| Median | 93.0% | 94.1% |
| Interquartile 25% (IQ1) | 90.6% | 91.8% |
| Interquartile 75% (IQ3) | 95.7% | 95.9% |
| Interquartile Range (IQR) | 5.1% | 4.1% |
| Standard Deviation (Sample) | 4.7% | 4.3% |
| Standard Deviation (Population) | 4.7% | 4.3% |
Similar Demographics by 11th Grade
Demographics Similar to Immigrants from Sudan by 11th Grade
In terms of 11th grade, the demographic groups most similar to Immigrants from Sudan are Immigrants from Hong Kong (92.2%, a difference of 0.0%), Kiowa (92.2%, a difference of 0.0%), Bolivian (92.2%, a difference of 0.0%), Immigrants from Eastern Africa (92.3%, a difference of 0.010%), and Immigrants from Oceania (92.2%, a difference of 0.010%).
| Demographics | Rating | Rank | 11th Grade |
| Panamanians | 26.4 /100 | #196 | Fair 92.3% |
| Marshallese | 26.0 /100 | #197 | Fair 92.3% |
| Hawaiians | 25.5 /100 | #198 | Fair 92.3% |
| Immigrants | Uganda | 25.2 /100 | #199 | Fair 92.3% |
| Samoans | 25.1 /100 | #200 | Fair 92.3% |
| Immigrants | China | 25.1 /100 | #201 | Fair 92.3% |
| Immigrants | Eastern Africa | 24.1 /100 | #202 | Fair 92.3% |
| Immigrants | Sudan | 23.5 /100 | #203 | Fair 92.3% |
| Immigrants | Hong Kong | 23.3 /100 | #204 | Fair 92.2% |
| Kiowa | 23.2 /100 | #205 | Fair 92.2% |
| Bolivians | 23.2 /100 | #206 | Fair 92.2% |
| Immigrants | Oceania | 22.4 /100 | #207 | Fair 92.2% |
| Colville | 21.8 /100 | #208 | Fair 92.2% |
| Tongans | 19.8 /100 | #209 | Poor 92.2% |
| Ethiopians | 18.8 /100 | #210 | Poor 92.2% |
Demographics Similar to Chippewa by 11th Grade
In terms of 11th grade, the demographic groups most similar to Chippewa are Lebanese (93.5%, a difference of 0.0%), Immigrants from Europe (93.5%, a difference of 0.0%), Immigrants from Serbia (93.5%, a difference of 0.0%), Immigrants from Romania (93.5%, a difference of 0.010%), and Immigrants from Croatia (93.5%, a difference of 0.010%).
| Demographics | Rating | Rank | 11th Grade |
| Immigrants | France | 99.0 /100 | #95 | Exceptional 93.6% |
| Immigrants | Turkey | 98.9 /100 | #96 | Exceptional 93.5% |
| Immigrants | Iran | 98.9 /100 | #97 | Exceptional 93.5% |
| Immigrants | Israel | 98.8 /100 | #98 | Exceptional 93.5% |
| Menominee | 98.7 /100 | #99 | Exceptional 93.5% |
| Immigrants | North Macedonia | 98.7 /100 | #100 | Exceptional 93.5% |
| Immigrants | Romania | 98.7 /100 | #101 | Exceptional 93.5% |
| Chippewa | 98.6 /100 | #102 | Exceptional 93.5% |
| Lebanese | 98.6 /100 | #103 | Exceptional 93.5% |
| Immigrants | Europe | 98.6 /100 | #104 | Exceptional 93.5% |
| Immigrants | Serbia | 98.6 /100 | #105 | Exceptional 93.5% |
| Immigrants | Croatia | 98.6 /100 | #106 | Exceptional 93.5% |
| Immigrants | Norway | 98.4 /100 | #107 | Exceptional 93.5% |
| Alaska Natives | 98.4 /100 | #108 | Exceptional 93.5% |
| Immigrants | Kuwait | 98.4 /100 | #109 | Exceptional 93.5% |