Immigrants from Greece vs Pueblo 11th Grade
COMPARE
Immigrants from Greece
Pueblo
11th Grade
11th Grade Comparison
Immigrants from Greece
Pueblo
93.2%
11TH GRADE
95.9/ 100
METRIC RATING
123rd/ 347
METRIC RANK
91.2%
11TH GRADE
0.3/ 100
METRIC RATING
265th/ 347
METRIC RANK
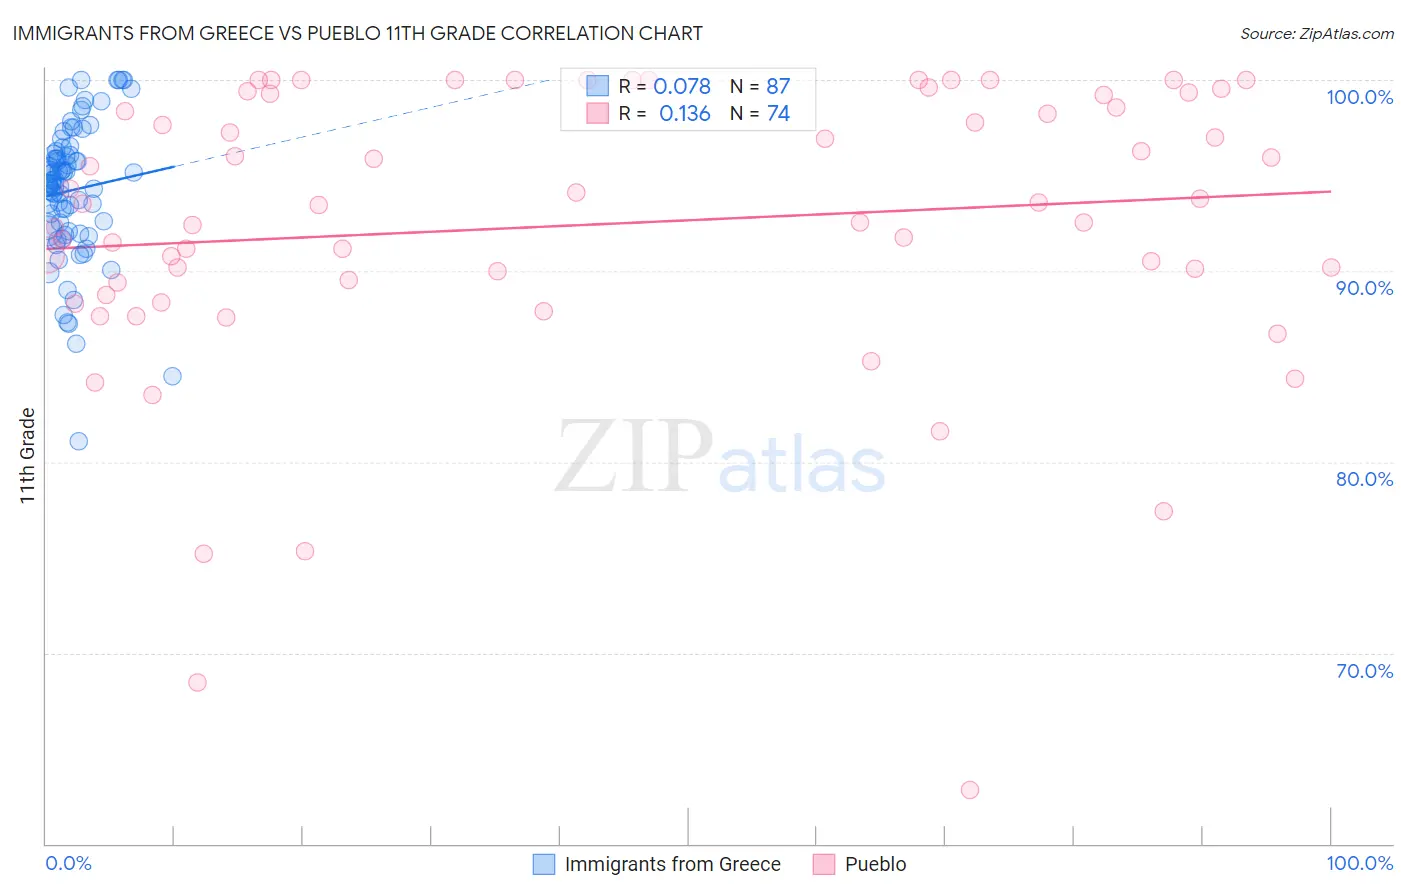
Immigrants from Greece vs Pueblo 11th Grade Correlation Chart
The statistical analysis conducted on geographies consisting of 216,879,847 people shows a slight positive correlation between the proportion of Immigrants from Greece and percentage of population with at least 11th grade education in the United States with a correlation coefficient (R) of 0.078 and weighted average of 93.2%. Similarly, the statistical analysis conducted on geographies consisting of 120,086,593 people shows a poor positive correlation between the proportion of Pueblo and percentage of population with at least 11th grade education in the United States with a correlation coefficient (R) of 0.136 and weighted average of 91.2%, a difference of 2.2%.
11th Grade Correlation Summary
| Measurement | Immigrants from Greece | Pueblo |
| Minimum | 81.1% | 62.8% |
| Maximum | 100.0% | 100.0% |
| Range | 18.9% | 37.2% |
| Mean | 94.2% | 92.4% |
| Median | 94.6% | 93.5% |
| Interquartile 25% (IQ1) | 92.1% | 89.4% |
| Interquartile 75% (IQ3) | 96.1% | 99.2% |
| Interquartile Range (IQR) | 4.0% | 9.8% |
| Standard Deviation (Sample) | 3.6% | 7.6% |
| Standard Deviation (Population) | 3.6% | 7.5% |
Similar Demographics by 11th Grade
Demographics Similar to Immigrants from Greece by 11th Grade
In terms of 11th grade, the demographic groups most similar to Immigrants from Greece are Immigrants from Eastern Europe (93.2%, a difference of 0.0%), Immigrants from Sri Lanka (93.2%, a difference of 0.020%), German Russian (93.3%, a difference of 0.030%), Immigrants from Belarus (93.3%, a difference of 0.030%), and Basque (93.2%, a difference of 0.040%).
| Demographics | Rating | Rank | 11th Grade |
| Immigrants | Hungary | 97.5 /100 | #116 | Exceptional 93.4% |
| Whites/Caucasians | 97.4 /100 | #117 | Exceptional 93.3% |
| Immigrants | Korea | 97.0 /100 | #118 | Exceptional 93.3% |
| Israelis | 97.0 /100 | #119 | Exceptional 93.3% |
| Immigrants | Russia | 96.6 /100 | #120 | Exceptional 93.3% |
| German Russians | 96.4 /100 | #121 | Exceptional 93.3% |
| Immigrants | Belarus | 96.3 /100 | #122 | Exceptional 93.3% |
| Immigrants | Greece | 95.9 /100 | #123 | Exceptional 93.2% |
| Immigrants | Eastern Europe | 95.9 /100 | #124 | Exceptional 93.2% |
| Immigrants | Sri Lanka | 95.6 /100 | #125 | Exceptional 93.2% |
| Basques | 95.2 /100 | #126 | Exceptional 93.2% |
| Immigrants | Kazakhstan | 92.4 /100 | #127 | Exceptional 93.1% |
| Immigrants | Jordan | 92.4 /100 | #128 | Exceptional 93.1% |
| Immigrants | Ukraine | 89.8 /100 | #129 | Excellent 93.0% |
| Albanians | 89.5 /100 | #130 | Excellent 93.0% |
Demographics Similar to Pueblo by 11th Grade
In terms of 11th grade, the demographic groups most similar to Pueblo are Yup'ik (91.2%, a difference of 0.0%), Immigrants from Ghana (91.2%, a difference of 0.020%), Immigrants from Western Africa (91.2%, a difference of 0.020%), Immigrants from Jamaica (91.2%, a difference of 0.030%), and U.S. Virgin Islander (91.1%, a difference of 0.10%).
| Demographics | Rating | Rank | 11th Grade |
| Immigrants | Colombia | 0.6 /100 | #258 | Tragic 91.4% |
| Jamaicans | 0.6 /100 | #259 | Tragic 91.4% |
| Spanish Americans | 0.6 /100 | #260 | Tragic 91.4% |
| Taiwanese | 0.6 /100 | #261 | Tragic 91.3% |
| Immigrants | Uruguay | 0.5 /100 | #262 | Tragic 91.3% |
| Immigrants | Ghana | 0.3 /100 | #263 | Tragic 91.2% |
| Yup'ik | 0.3 /100 | #264 | Tragic 91.2% |
| Pueblo | 0.3 /100 | #265 | Tragic 91.2% |
| Immigrants | Western Africa | 0.3 /100 | #266 | Tragic 91.2% |
| Immigrants | Jamaica | 0.3 /100 | #267 | Tragic 91.2% |
| U.S. Virgin Islanders | 0.2 /100 | #268 | Tragic 91.1% |
| Ute | 0.2 /100 | #269 | Tragic 91.1% |
| Trinidadians and Tobagonians | 0.2 /100 | #270 | Tragic 91.1% |
| Immigrants | Peru | 0.1 /100 | #271 | Tragic 91.0% |
| West Indians | 0.1 /100 | #272 | Tragic 91.0% |