Immigrants from Northern Africa vs Pueblo 11th Grade
COMPARE
Immigrants from Northern Africa
Pueblo
11th Grade
11th Grade Comparison
Immigrants from Northern Africa
Pueblo
92.6%
11TH GRADE
57.3/ 100
METRIC RATING
170th/ 347
METRIC RANK
91.2%
11TH GRADE
0.3/ 100
METRIC RATING
265th/ 347
METRIC RANK
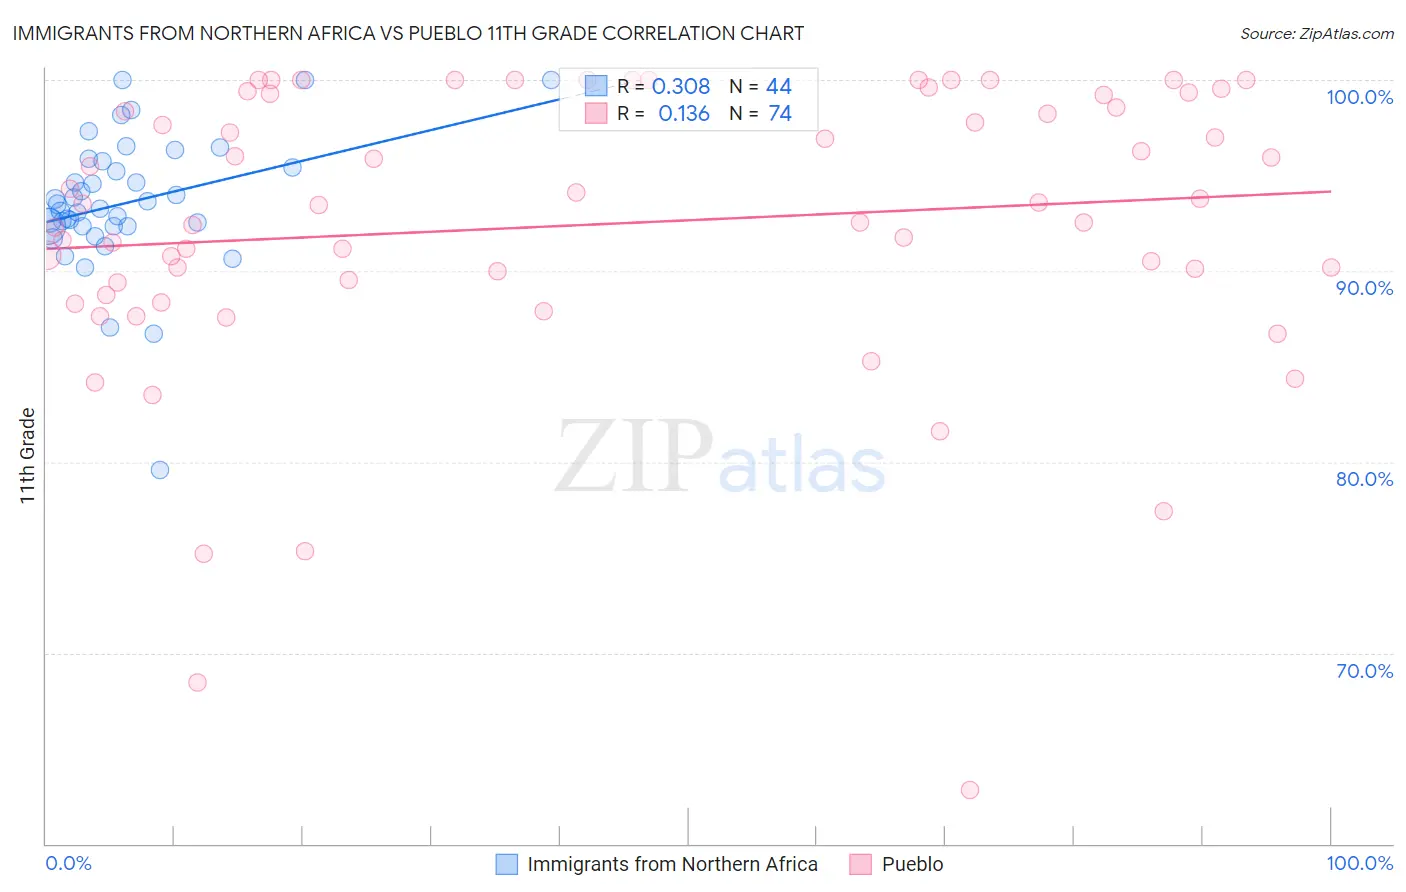
Immigrants from Northern Africa vs Pueblo 11th Grade Correlation Chart
The statistical analysis conducted on geographies consisting of 321,196,768 people shows a mild positive correlation between the proportion of Immigrants from Northern Africa and percentage of population with at least 11th grade education in the United States with a correlation coefficient (R) of 0.308 and weighted average of 92.6%. Similarly, the statistical analysis conducted on geographies consisting of 120,086,593 people shows a poor positive correlation between the proportion of Pueblo and percentage of population with at least 11th grade education in the United States with a correlation coefficient (R) of 0.136 and weighted average of 91.2%, a difference of 1.5%.
11th Grade Correlation Summary
| Measurement | Immigrants from Northern Africa | Pueblo |
| Minimum | 79.6% | 62.8% |
| Maximum | 100.0% | 100.0% |
| Range | 20.4% | 37.2% |
| Mean | 93.6% | 92.4% |
| Median | 93.4% | 93.5% |
| Interquartile 25% (IQ1) | 92.3% | 89.4% |
| Interquartile 75% (IQ3) | 95.6% | 99.2% |
| Interquartile Range (IQR) | 3.2% | 9.8% |
| Standard Deviation (Sample) | 3.6% | 7.6% |
| Standard Deviation (Population) | 3.6% | 7.5% |
Similar Demographics by 11th Grade
Demographics Similar to Immigrants from Northern Africa by 11th Grade
In terms of 11th grade, the demographic groups most similar to Immigrants from Northern Africa are Immigrants from Albania (92.6%, a difference of 0.0%), Sierra Leonean (92.6%, a difference of 0.010%), Alsatian (92.6%, a difference of 0.030%), Laotian (92.6%, a difference of 0.030%), and Bermudan (92.6%, a difference of 0.050%).
| Demographics | Rating | Rank | 11th Grade |
| Immigrants | Nonimmigrants | 66.6 /100 | #163 | Good 92.7% |
| Spanish | 66.2 /100 | #164 | Good 92.7% |
| Immigrants | Iraq | 63.7 /100 | #165 | Good 92.6% |
| Bermudans | 62.3 /100 | #166 | Good 92.6% |
| Alsatians | 60.2 /100 | #167 | Good 92.6% |
| Sierra Leoneans | 58.7 /100 | #168 | Average 92.6% |
| Immigrants | Albania | 57.8 /100 | #169 | Average 92.6% |
| Immigrants | Northern Africa | 57.3 /100 | #170 | Average 92.6% |
| Laotians | 54.4 /100 | #171 | Average 92.6% |
| Immigrants | Pakistan | 52.3 /100 | #172 | Average 92.5% |
| Indians (Asian) | 51.5 /100 | #173 | Average 92.5% |
| Asians | 50.0 /100 | #174 | Average 92.5% |
| Shoshone | 48.9 /100 | #175 | Average 92.5% |
| Spaniards | 46.9 /100 | #176 | Average 92.5% |
| Guamanians/Chamorros | 45.0 /100 | #177 | Average 92.5% |
Demographics Similar to Pueblo by 11th Grade
In terms of 11th grade, the demographic groups most similar to Pueblo are Yup'ik (91.2%, a difference of 0.0%), Immigrants from Ghana (91.2%, a difference of 0.020%), Immigrants from Western Africa (91.2%, a difference of 0.020%), Immigrants from Jamaica (91.2%, a difference of 0.030%), and U.S. Virgin Islander (91.1%, a difference of 0.10%).
| Demographics | Rating | Rank | 11th Grade |
| Immigrants | Colombia | 0.6 /100 | #258 | Tragic 91.4% |
| Jamaicans | 0.6 /100 | #259 | Tragic 91.4% |
| Spanish Americans | 0.6 /100 | #260 | Tragic 91.4% |
| Taiwanese | 0.6 /100 | #261 | Tragic 91.3% |
| Immigrants | Uruguay | 0.5 /100 | #262 | Tragic 91.3% |
| Immigrants | Ghana | 0.3 /100 | #263 | Tragic 91.2% |
| Yup'ik | 0.3 /100 | #264 | Tragic 91.2% |
| Pueblo | 0.3 /100 | #265 | Tragic 91.2% |
| Immigrants | Western Africa | 0.3 /100 | #266 | Tragic 91.2% |
| Immigrants | Jamaica | 0.3 /100 | #267 | Tragic 91.2% |
| U.S. Virgin Islanders | 0.2 /100 | #268 | Tragic 91.1% |
| Ute | 0.2 /100 | #269 | Tragic 91.1% |
| Trinidadians and Tobagonians | 0.2 /100 | #270 | Tragic 91.1% |
| Immigrants | Peru | 0.1 /100 | #271 | Tragic 91.0% |
| West Indians | 0.1 /100 | #272 | Tragic 91.0% |