Immigrants from St. Vincent and the Grenadines vs Pueblo 11th Grade
COMPARE
Immigrants from St. Vincent and the Grenadines
Pueblo
11th Grade
11th Grade Comparison
Immigrants from St. Vincent and the Grenadines
Pueblo
90.7%
11TH GRADE
0.0/ 100
METRIC RATING
282nd/ 347
METRIC RANK
91.2%
11TH GRADE
0.3/ 100
METRIC RATING
265th/ 347
METRIC RANK
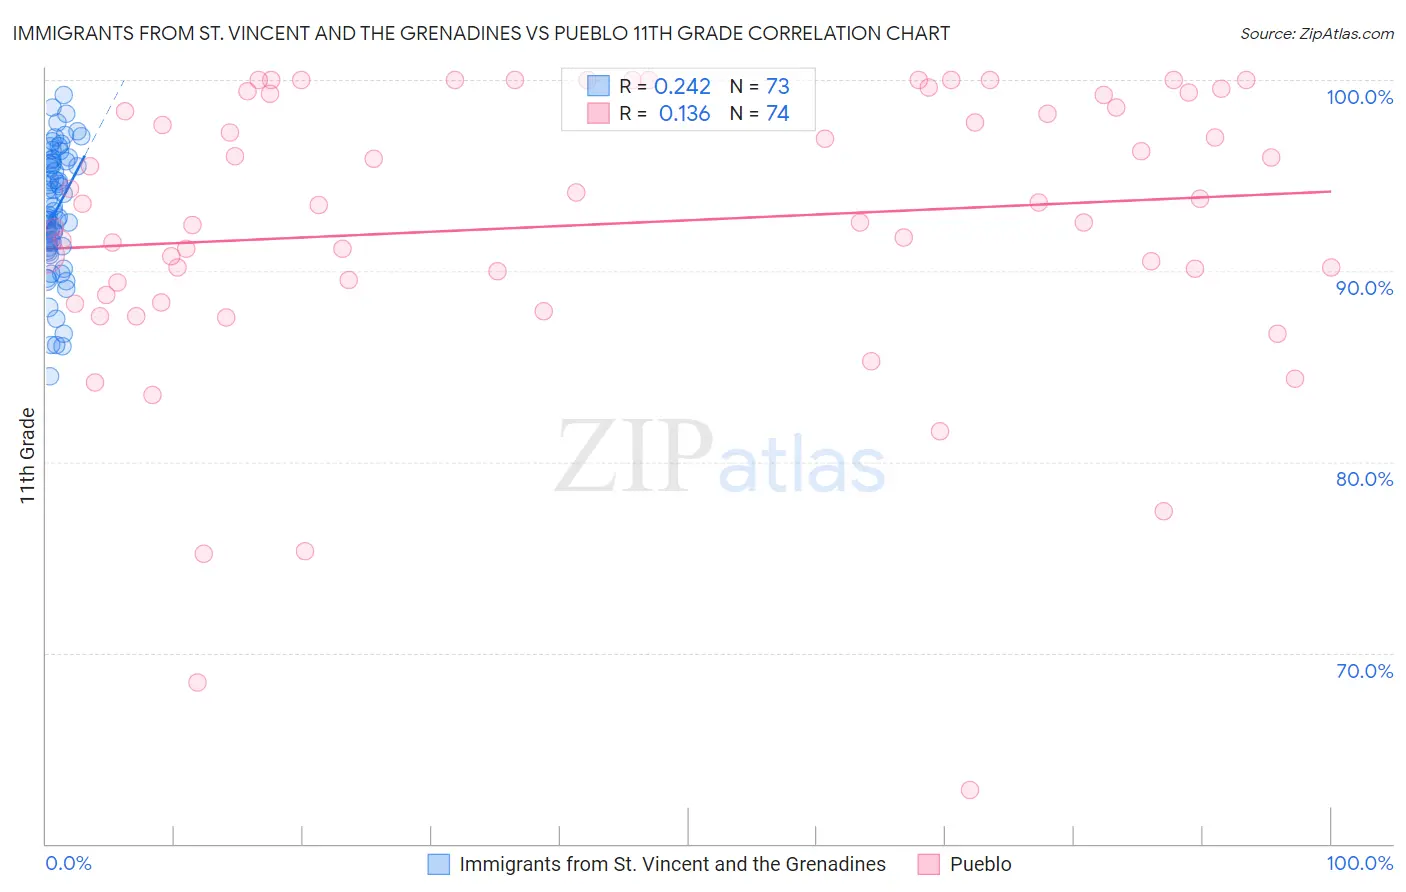
Immigrants from St. Vincent and the Grenadines vs Pueblo 11th Grade Correlation Chart
The statistical analysis conducted on geographies consisting of 56,191,418 people shows a weak positive correlation between the proportion of Immigrants from St. Vincent and the Grenadines and percentage of population with at least 11th grade education in the United States with a correlation coefficient (R) of 0.242 and weighted average of 90.7%. Similarly, the statistical analysis conducted on geographies consisting of 120,086,593 people shows a poor positive correlation between the proportion of Pueblo and percentage of population with at least 11th grade education in the United States with a correlation coefficient (R) of 0.136 and weighted average of 91.2%, a difference of 0.59%.
11th Grade Correlation Summary
| Measurement | Immigrants from St. Vincent and the Grenadines | Pueblo |
| Minimum | 84.5% | 62.8% |
| Maximum | 99.2% | 100.0% |
| Range | 14.7% | 37.2% |
| Mean | 93.1% | 92.4% |
| Median | 93.0% | 93.5% |
| Interquartile 25% (IQ1) | 91.2% | 89.4% |
| Interquartile 75% (IQ3) | 95.7% | 99.2% |
| Interquartile Range (IQR) | 4.5% | 9.8% |
| Standard Deviation (Sample) | 3.3% | 7.6% |
| Standard Deviation (Population) | 3.3% | 7.5% |
Demographics Similar to Immigrants from St. Vincent and the Grenadines and Pueblo by 11th Grade
In terms of 11th grade, the demographic groups most similar to Immigrants from St. Vincent and the Grenadines are Dutch West Indian (90.7%, a difference of 0.010%), Immigrants from Barbados (90.7%, a difference of 0.010%), Sri Lankan (90.7%, a difference of 0.060%), Barbadian (90.8%, a difference of 0.13%), and Malaysian (90.8%, a difference of 0.17%). Similarly, the demographic groups most similar to Pueblo are Yup'ik (91.2%, a difference of 0.0%), Immigrants from Ghana (91.2%, a difference of 0.020%), Immigrants from Western Africa (91.2%, a difference of 0.020%), Immigrants from Jamaica (91.2%, a difference of 0.030%), and U.S. Virgin Islander (91.1%, a difference of 0.10%).
| Demographics | Rating | Rank | 11th Grade |
| Immigrants | Ghana | 0.3 /100 | #263 | Tragic 91.2% |
| Yup'ik | 0.3 /100 | #264 | Tragic 91.2% |
| Pueblo | 0.3 /100 | #265 | Tragic 91.2% |
| Immigrants | Western Africa | 0.3 /100 | #266 | Tragic 91.2% |
| Immigrants | Jamaica | 0.3 /100 | #267 | Tragic 91.2% |
| U.S. Virgin Islanders | 0.2 /100 | #268 | Tragic 91.1% |
| Ute | 0.2 /100 | #269 | Tragic 91.1% |
| Trinidadians and Tobagonians | 0.2 /100 | #270 | Tragic 91.1% |
| Immigrants | Peru | 0.1 /100 | #271 | Tragic 91.0% |
| West Indians | 0.1 /100 | #272 | Tragic 91.0% |
| Paiute | 0.1 /100 | #273 | Tragic 91.0% |
| Immigrants | Trinidad and Tobago | 0.1 /100 | #274 | Tragic 90.9% |
| Immigrants | South Eastern Asia | 0.1 /100 | #275 | Tragic 90.9% |
| Bangladeshis | 0.1 /100 | #276 | Tragic 90.9% |
| Immigrants | Congo | 0.1 /100 | #277 | Tragic 90.9% |
| Malaysians | 0.1 /100 | #278 | Tragic 90.8% |
| Barbadians | 0.0 /100 | #279 | Tragic 90.8% |
| Sri Lankans | 0.0 /100 | #280 | Tragic 90.7% |
| Dutch West Indians | 0.0 /100 | #281 | Tragic 90.7% |
| Immigrants | St. Vincent and the Grenadines | 0.0 /100 | #282 | Tragic 90.7% |
| Immigrants | Barbados | 0.0 /100 | #283 | Tragic 90.7% |