Immigrants from South Eastern Asia vs Iroquois Master's Degree
COMPARE
Immigrants from South Eastern Asia
Iroquois
Master's Degree
Master's Degree Comparison
Immigrants from South Eastern Asia
Iroquois
14.0%
MASTER'S DEGREE
11.9/ 100
METRIC RATING
223rd/ 347
METRIC RANK
12.9%
MASTER'S DEGREE
1.4/ 100
METRIC RATING
247th/ 347
METRIC RANK
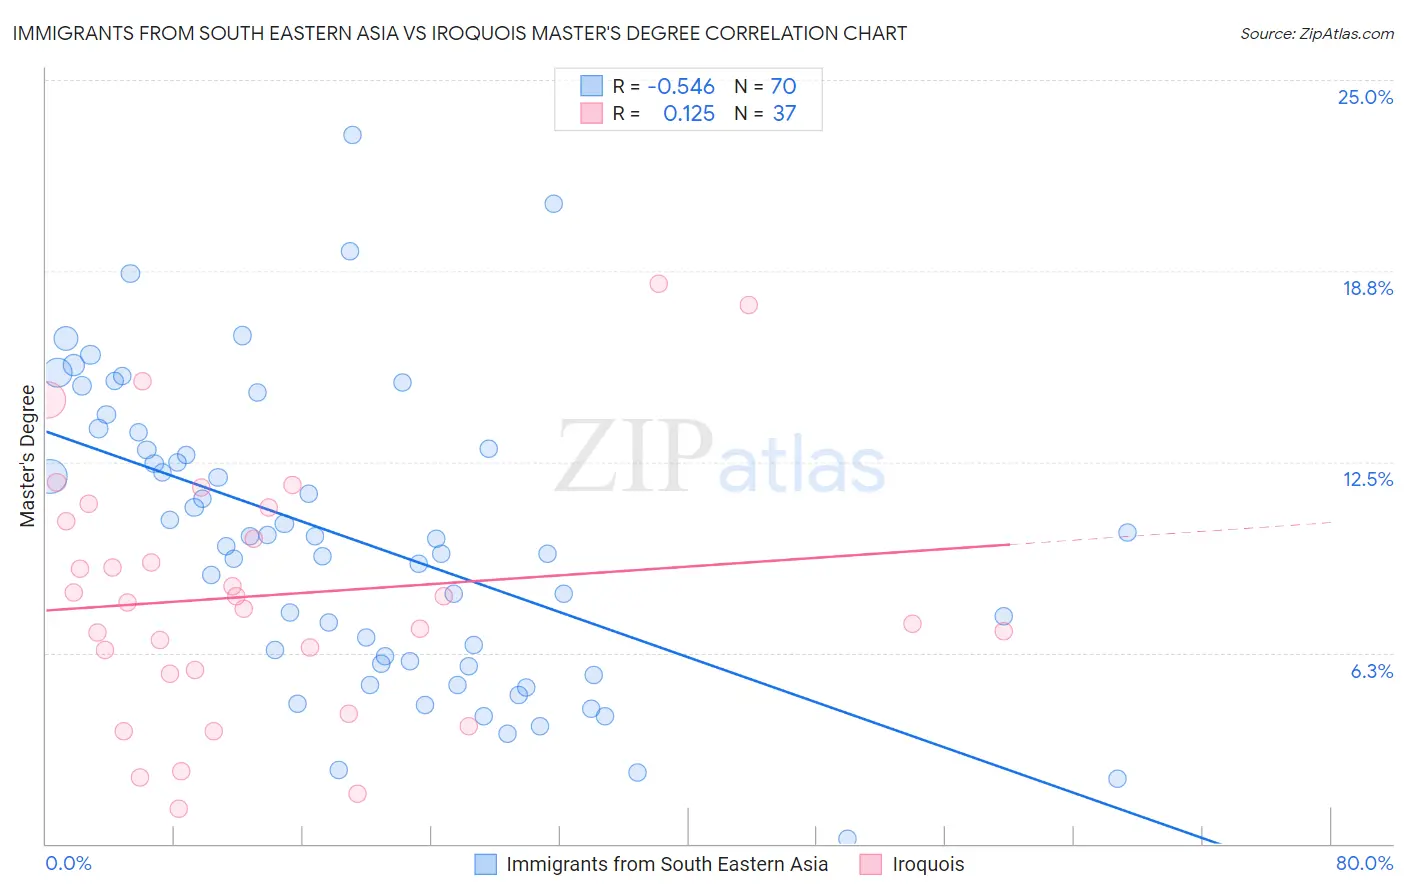
Immigrants from South Eastern Asia vs Iroquois Master's Degree Correlation Chart
The statistical analysis conducted on geographies consisting of 512,403,638 people shows a substantial negative correlation between the proportion of Immigrants from South Eastern Asia and percentage of population with at least master's degree education in the United States with a correlation coefficient (R) of -0.546 and weighted average of 14.0%. Similarly, the statistical analysis conducted on geographies consisting of 207,281,799 people shows a poor positive correlation between the proportion of Iroquois and percentage of population with at least master's degree education in the United States with a correlation coefficient (R) of 0.125 and weighted average of 12.9%, a difference of 8.3%.
Master's Degree Correlation Summary
| Measurement | Immigrants from South Eastern Asia | Iroquois |
| Minimum | 0.15% | 1.2% |
| Maximum | 23.2% | 18.3% |
| Range | 23.0% | 17.2% |
| Mean | 9.9% | 8.1% |
| Median | 9.9% | 7.9% |
| Interquartile 25% (IQ1) | 5.9% | 5.6% |
| Interquartile 75% (IQ3) | 12.9% | 10.8% |
| Interquartile Range (IQR) | 7.1% | 5.2% |
| Standard Deviation (Sample) | 4.9% | 4.1% |
| Standard Deviation (Population) | 4.8% | 4.1% |
Similar Demographics by Master's Degree
Demographics Similar to Immigrants from South Eastern Asia by Master's Degree
In terms of master's degree, the demographic groups most similar to Immigrants from South Eastern Asia are Immigrants from Grenada (14.0%, a difference of 0.050%), Ecuadorian (14.0%, a difference of 0.20%), Korean (14.0%, a difference of 0.23%), Portuguese (13.9%, a difference of 0.26%), and Immigrants from St. Vincent and the Grenadines (13.9%, a difference of 0.31%).
| Demographics | Rating | Rank | Master's Degree |
| Immigrants | Somalia | 15.8 /100 | #216 | Poor 14.1% |
| Immigrants | Trinidad and Tobago | 15.8 /100 | #217 | Poor 14.1% |
| French Canadians | 14.9 /100 | #218 | Poor 14.1% |
| Norwegians | 13.6 /100 | #219 | Poor 14.0% |
| Germans | 13.1 /100 | #220 | Poor 14.0% |
| Koreans | 12.7 /100 | #221 | Poor 14.0% |
| Ecuadorians | 12.6 /100 | #222 | Poor 14.0% |
| Immigrants | South Eastern Asia | 11.9 /100 | #223 | Poor 14.0% |
| Immigrants | Grenada | 11.8 /100 | #224 | Poor 14.0% |
| Portuguese | 11.2 /100 | #225 | Poor 13.9% |
| Immigrants | St. Vincent and the Grenadines | 11.0 /100 | #226 | Poor 13.9% |
| Immigrants | West Indies | 9.8 /100 | #227 | Tragic 13.9% |
| Whites/Caucasians | 9.1 /100 | #228 | Tragic 13.8% |
| British West Indians | 8.8 /100 | #229 | Tragic 13.8% |
| Dutch | 8.7 /100 | #230 | Tragic 13.8% |
Demographics Similar to Iroquois by Master's Degree
In terms of master's degree, the demographic groups most similar to Iroquois are Immigrants from Cambodia (12.9%, a difference of 0.030%), Immigrants from Bahamas (12.9%, a difference of 0.070%), African (12.9%, a difference of 0.090%), Cree (12.8%, a difference of 0.40%), and Liberian (12.8%, a difference of 0.40%).
| Demographics | Rating | Rank | Master's Degree |
| Guamanians/Chamorros | 2.2 /100 | #240 | Tragic 13.1% |
| U.S. Virgin Islanders | 2.1 /100 | #241 | Tragic 13.1% |
| Spanish Americans | 1.9 /100 | #242 | Tragic 13.0% |
| Immigrants | Jamaica | 1.9 /100 | #243 | Tragic 13.0% |
| Delaware | 1.7 /100 | #244 | Tragic 13.0% |
| Immigrants | Bahamas | 1.4 /100 | #245 | Tragic 12.9% |
| Immigrants | Cambodia | 1.4 /100 | #246 | Tragic 12.9% |
| Iroquois | 1.4 /100 | #247 | Tragic 12.9% |
| Africans | 1.4 /100 | #248 | Tragic 12.9% |
| Cree | 1.3 /100 | #249 | Tragic 12.8% |
| Liberians | 1.3 /100 | #250 | Tragic 12.8% |
| Tlingit-Haida | 1.3 /100 | #251 | Tragic 12.8% |
| French American Indians | 1.0 /100 | #252 | Tragic 12.7% |
| Immigrants | Dominica | 0.8 /100 | #253 | Tragic 12.6% |
| Indonesians | 0.8 /100 | #254 | Tragic 12.6% |