Chinese vs English 7th Grade
COMPARE
Chinese
English
7th Grade
7th Grade Comparison
Chinese
English
97.1%
7TH GRADE
99.9/ 100
METRIC RATING
42nd/ 347
METRIC RANK
97.6%
7TH GRADE
100.0/ 100
METRIC RATING
15th/ 347
METRIC RANK
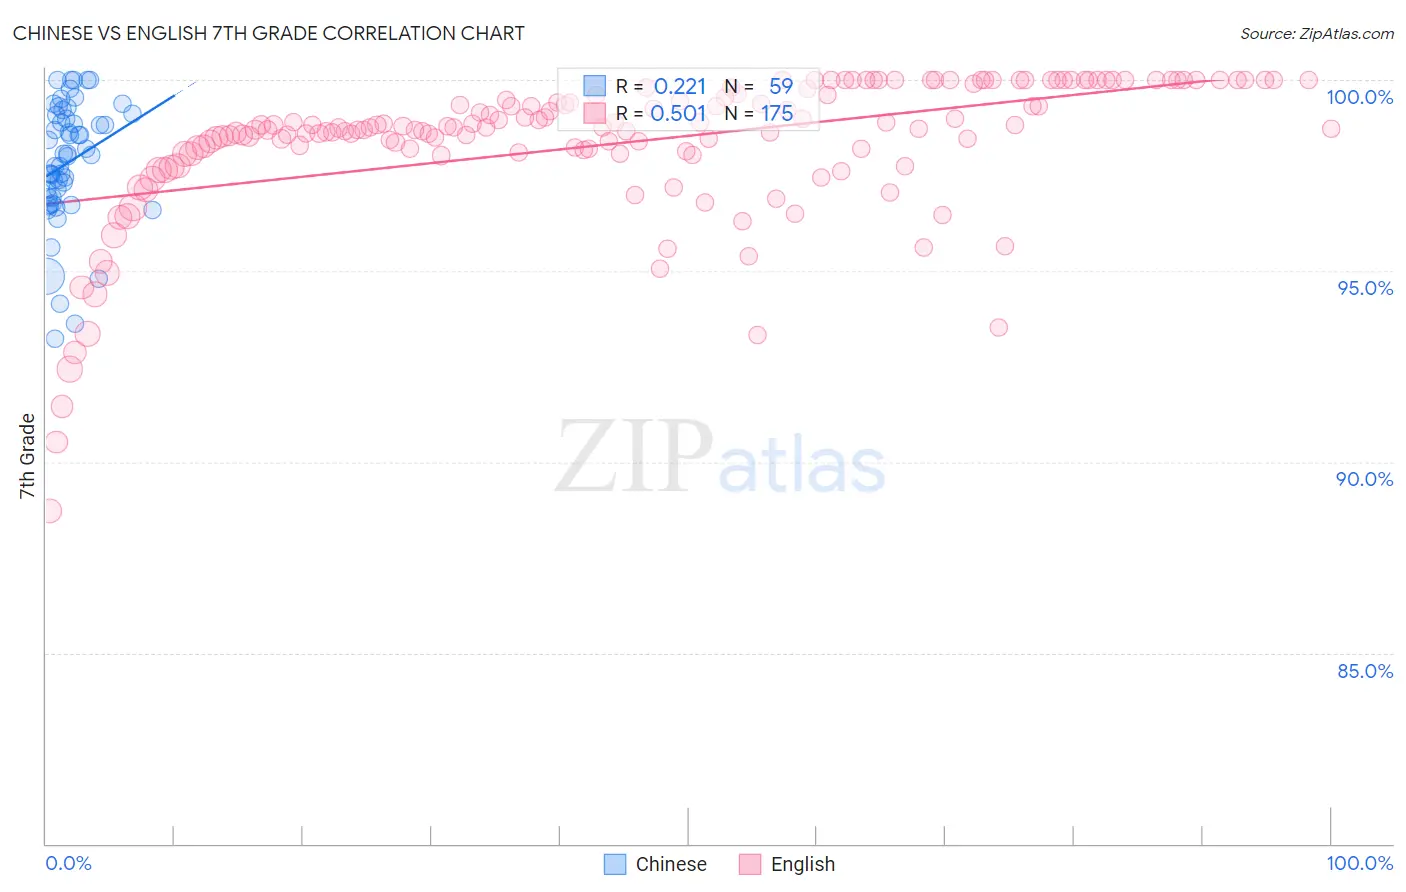
Chinese vs English 7th Grade Correlation Chart
The statistical analysis conducted on geographies consisting of 64,809,883 people shows a weak positive correlation between the proportion of Chinese and percentage of population with at least 7th grade education in the United States with a correlation coefficient (R) of 0.221 and weighted average of 97.1%. Similarly, the statistical analysis conducted on geographies consisting of 579,981,272 people shows a substantial positive correlation between the proportion of English and percentage of population with at least 7th grade education in the United States with a correlation coefficient (R) of 0.501 and weighted average of 97.6%, a difference of 0.45%.
7th Grade Correlation Summary
| Measurement | Chinese | English |
| Minimum | 93.2% | 88.7% |
| Maximum | 100.0% | 100.0% |
| Range | 6.8% | 11.3% |
| Mean | 97.8% | 98.3% |
| Median | 98.0% | 98.7% |
| Interquartile 25% (IQ1) | 96.9% | 98.1% |
| Interquartile 75% (IQ3) | 99.1% | 99.6% |
| Interquartile Range (IQR) | 2.2% | 1.5% |
| Standard Deviation (Sample) | 1.6% | 1.9% |
| Standard Deviation (Population) | 1.6% | 1.9% |
Similar Demographics by 7th Grade
Demographics Similar to Chinese by 7th Grade
In terms of 7th grade, the demographic groups most similar to Chinese are Maltese (97.1%, a difference of 0.030%), Eastern European (97.2%, a difference of 0.040%), Northern European (97.1%, a difference of 0.040%), Czechoslovakian (97.1%, a difference of 0.040%), and Aleut (97.1%, a difference of 0.050%).
| Demographics | Rating | Rank | 7th Grade |
| Swiss | 100.0 /100 | #35 | Exceptional 97.3% |
| Hungarians | 100.0 /100 | #36 | Exceptional 97.2% |
| British | 100.0 /100 | #37 | Exceptional 97.2% |
| Belgians | 100.0 /100 | #38 | Exceptional 97.2% |
| Latvians | 100.0 /100 | #39 | Exceptional 97.2% |
| Luxembourgers | 100.0 /100 | #40 | Exceptional 97.2% |
| Eastern Europeans | 100.0 /100 | #41 | Exceptional 97.2% |
| Chinese | 99.9 /100 | #42 | Exceptional 97.1% |
| Maltese | 99.9 /100 | #43 | Exceptional 97.1% |
| Northern Europeans | 99.9 /100 | #44 | Exceptional 97.1% |
| Czechoslovakians | 99.9 /100 | #45 | Exceptional 97.1% |
| Aleuts | 99.9 /100 | #46 | Exceptional 97.1% |
| Bulgarians | 99.9 /100 | #47 | Exceptional 97.1% |
| Celtics | 99.9 /100 | #48 | Exceptional 97.1% |
| Slavs | 99.9 /100 | #49 | Exceptional 97.1% |
Demographics Similar to English by 7th Grade
In terms of 7th grade, the demographic groups most similar to English are Pennsylvania German (97.6%, a difference of 0.010%), Swedish (97.6%, a difference of 0.020%), Alaskan Athabascan (97.6%, a difference of 0.060%), Polish (97.6%, a difference of 0.060%), and Irish (97.5%, a difference of 0.060%).
| Demographics | Rating | Rank | 7th Grade |
| Slovaks | 100.0 /100 | #8 | Exceptional 97.8% |
| Germans | 100.0 /100 | #9 | Exceptional 97.7% |
| Slovenes | 100.0 /100 | #10 | Exceptional 97.6% |
| Alaskan Athabascans | 100.0 /100 | #11 | Exceptional 97.6% |
| Poles | 100.0 /100 | #12 | Exceptional 97.6% |
| Swedes | 100.0 /100 | #13 | Exceptional 97.6% |
| Pennsylvania Germans | 100.0 /100 | #14 | Exceptional 97.6% |
| English | 100.0 /100 | #15 | Exceptional 97.6% |
| Irish | 100.0 /100 | #16 | Exceptional 97.5% |
| Scottish | 100.0 /100 | #17 | Exceptional 97.5% |
| Tlingit-Haida | 100.0 /100 | #18 | Exceptional 97.5% |
| Lithuanians | 100.0 /100 | #19 | Exceptional 97.5% |
| Yup'ik | 100.0 /100 | #20 | Exceptional 97.4% |
| Inupiat | 100.0 /100 | #21 | Exceptional 97.4% |
| French Canadians | 100.0 /100 | #22 | Exceptional 97.4% |