Immigrants from Ghana vs German Russian 8th Grade
COMPARE
Immigrants from Ghana
German Russian
8th Grade
8th Grade Comparison
Immigrants from Ghana
German Russians
94.8%
8TH GRADE
0.3/ 100
METRIC RATING
267th/ 347
METRIC RANK
96.4%
8TH GRADE
98.8/ 100
METRIC RATING
95th/ 347
METRIC RANK
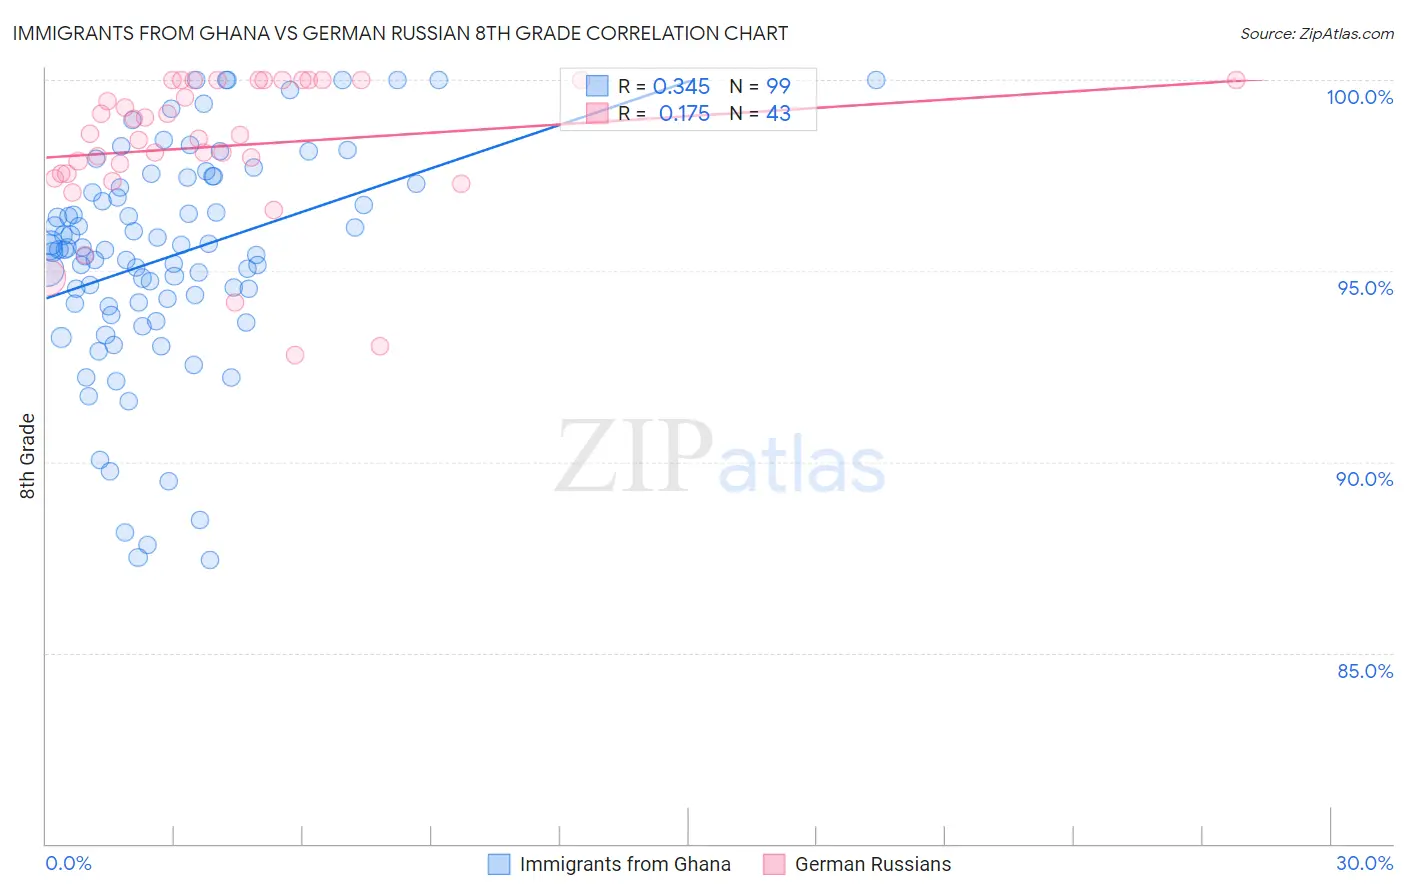
Immigrants from Ghana vs German Russian 8th Grade Correlation Chart
The statistical analysis conducted on geographies consisting of 199,952,023 people shows a mild positive correlation between the proportion of Immigrants from Ghana and percentage of population with at least 8th grade education in the United States with a correlation coefficient (R) of 0.345 and weighted average of 94.8%. Similarly, the statistical analysis conducted on geographies consisting of 96,461,984 people shows a poor positive correlation between the proportion of German Russians and percentage of population with at least 8th grade education in the United States with a correlation coefficient (R) of 0.175 and weighted average of 96.4%, a difference of 1.7%.
8th Grade Correlation Summary
| Measurement | Immigrants from Ghana | German Russian |
| Minimum | 87.4% | 92.8% |
| Maximum | 100.0% | 100.0% |
| Range | 12.6% | 7.2% |
| Mean | 95.4% | 98.3% |
| Median | 95.6% | 98.5% |
| Interquartile 25% (IQ1) | 94.1% | 97.5% |
| Interquartile 75% (IQ3) | 97.3% | 100.0% |
| Interquartile Range (IQR) | 3.1% | 2.5% |
| Standard Deviation (Sample) | 2.9% | 1.9% |
| Standard Deviation (Population) | 2.9% | 1.9% |
Similar Demographics by 8th Grade
Demographics Similar to Immigrants from Ghana by 8th Grade
In terms of 8th grade, the demographic groups most similar to Immigrants from Ghana are Immigrants from Uruguay (94.8%, a difference of 0.0%), West Indian (94.8%, a difference of 0.010%), Immigrants from Thailand (94.8%, a difference of 0.020%), Immigrants from Uzbekistan (94.8%, a difference of 0.040%), and Immigrants from Afghanistan (94.8%, a difference of 0.050%).
| Demographics | Rating | Rank | 8th Grade |
| Immigrants | Jamaica | 0.6 /100 | #260 | Tragic 94.9% |
| Immigrants | Costa Rica | 0.5 /100 | #261 | Tragic 94.9% |
| Immigrants | Nigeria | 0.4 /100 | #262 | Tragic 94.9% |
| Immigrants | Hong Kong | 0.4 /100 | #263 | Tragic 94.9% |
| South Americans | 0.4 /100 | #264 | Tragic 94.9% |
| Yuman | 0.4 /100 | #265 | Tragic 94.9% |
| West Indians | 0.3 /100 | #266 | Tragic 94.8% |
| Immigrants | Ghana | 0.3 /100 | #267 | Tragic 94.8% |
| Immigrants | Uruguay | 0.3 /100 | #268 | Tragic 94.8% |
| Immigrants | Thailand | 0.2 /100 | #269 | Tragic 94.8% |
| Immigrants | Uzbekistan | 0.2 /100 | #270 | Tragic 94.8% |
| Immigrants | Afghanistan | 0.2 /100 | #271 | Tragic 94.8% |
| Immigrants | South America | 0.2 /100 | #272 | Tragic 94.8% |
| Immigrants | Western Africa | 0.2 /100 | #273 | Tragic 94.8% |
| Trinidadians and Tobagonians | 0.2 /100 | #274 | Tragic 94.7% |
Demographics Similar to German Russians by 8th Grade
In terms of 8th grade, the demographic groups most similar to German Russians are Immigrants from Singapore (96.4%, a difference of 0.0%), Immigrants from Sweden (96.4%, a difference of 0.010%), Thai (96.4%, a difference of 0.010%), Menominee (96.4%, a difference of 0.010%), and Immigrants from Denmark (96.4%, a difference of 0.010%).
| Demographics | Rating | Rank | 8th Grade |
| Immigrants | Western Europe | 99.0 /100 | #88 | Exceptional 96.4% |
| Chickasaw | 98.9 /100 | #89 | Exceptional 96.4% |
| Immigrants | Sweden | 98.9 /100 | #90 | Exceptional 96.4% |
| Thais | 98.9 /100 | #91 | Exceptional 96.4% |
| Menominee | 98.9 /100 | #92 | Exceptional 96.4% |
| Immigrants | Denmark | 98.8 /100 | #93 | Exceptional 96.4% |
| Immigrants | Singapore | 98.8 /100 | #94 | Exceptional 96.4% |
| German Russians | 98.8 /100 | #95 | Exceptional 96.4% |
| Potawatomi | 98.7 /100 | #96 | Exceptional 96.4% |
| Osage | 98.7 /100 | #97 | Exceptional 96.4% |
| Immigrants | Germany | 98.7 /100 | #98 | Exceptional 96.4% |
| Cree | 98.6 /100 | #99 | Exceptional 96.4% |
| Immigrants | Czechoslovakia | 98.6 /100 | #100 | Exceptional 96.4% |
| Bhutanese | 98.2 /100 | #101 | Exceptional 96.4% |
| South Africans | 98.2 /100 | #102 | Exceptional 96.4% |