Immigrants from Germany vs Immigrants from Czechoslovakia 10th Grade
COMPARE
Immigrants from Germany
Immigrants from Czechoslovakia
10th Grade
10th Grade Comparison
Immigrants from Germany
Immigrants from Czechoslovakia
94.6%
10TH GRADE
98.3/ 100
METRIC RATING
94th/ 347
METRIC RANK
94.7%
10TH GRADE
99.2/ 100
METRIC RATING
79th/ 347
METRIC RANK
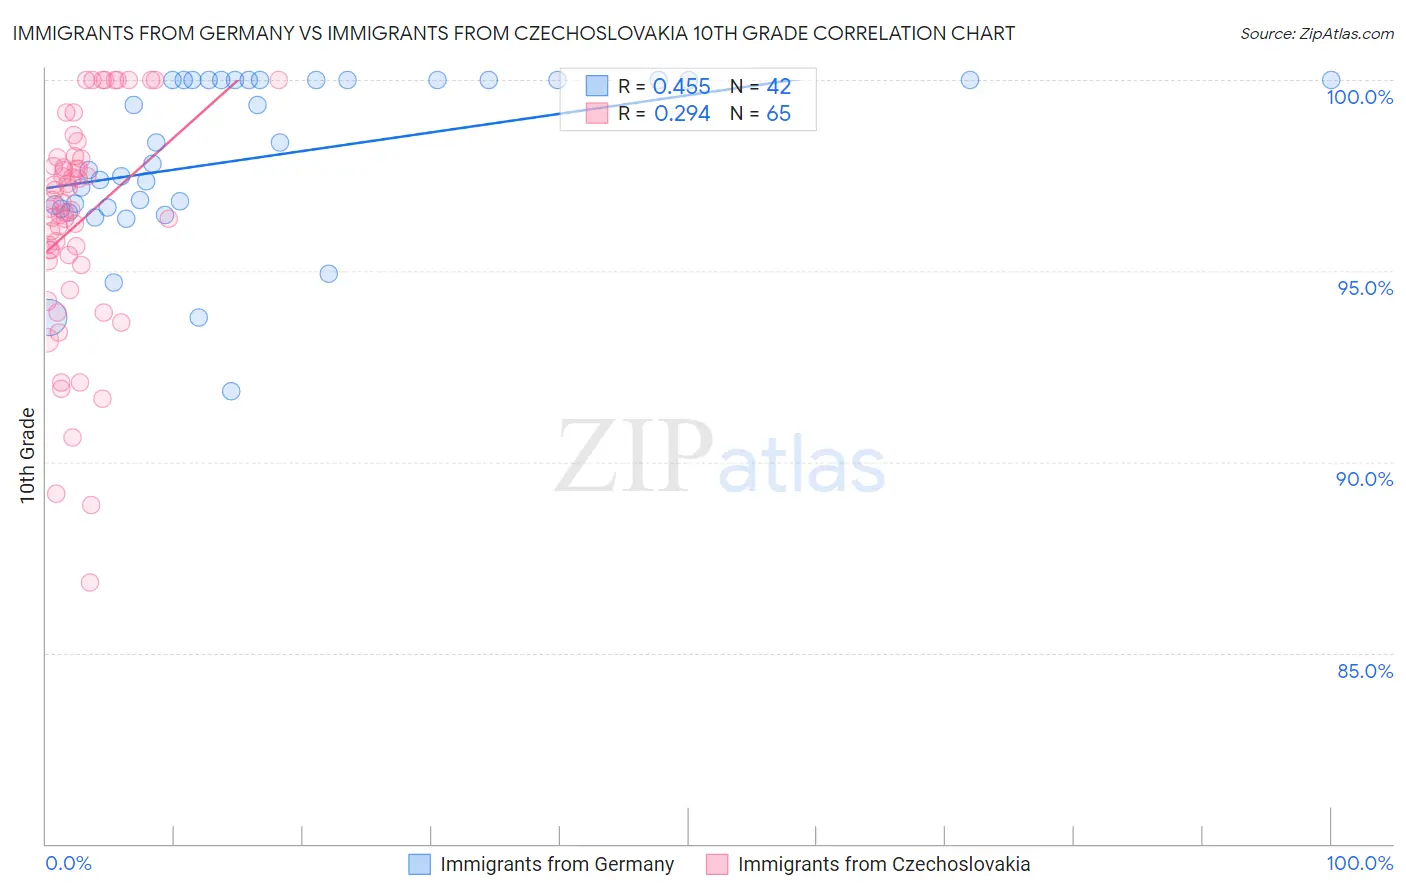
Immigrants from Germany vs Immigrants from Czechoslovakia 10th Grade Correlation Chart
The statistical analysis conducted on geographies consisting of 463,886,920 people shows a moderate positive correlation between the proportion of Immigrants from Germany and percentage of population with at least 10th grade education in the United States with a correlation coefficient (R) of 0.455 and weighted average of 94.6%. Similarly, the statistical analysis conducted on geographies consisting of 195,448,106 people shows a weak positive correlation between the proportion of Immigrants from Czechoslovakia and percentage of population with at least 10th grade education in the United States with a correlation coefficient (R) of 0.294 and weighted average of 94.7%, a difference of 0.18%.
10th Grade Correlation Summary
| Measurement | Immigrants from Germany | Immigrants from Czechoslovakia |
| Minimum | 91.9% | 86.9% |
| Maximum | 100.0% | 100.0% |
| Range | 8.1% | 13.1% |
| Mean | 98.0% | 96.3% |
| Median | 98.1% | 96.6% |
| Interquartile 25% (IQ1) | 96.7% | 95.2% |
| Interquartile 75% (IQ3) | 100.0% | 98.0% |
| Interquartile Range (IQR) | 3.3% | 2.8% |
| Standard Deviation (Sample) | 2.1% | 2.9% |
| Standard Deviation (Population) | 2.1% | 2.9% |
Demographics Similar to Immigrants from Germany and Immigrants from Czechoslovakia by 10th Grade
In terms of 10th grade, the demographic groups most similar to Immigrants from Germany are Soviet Union (94.6%, a difference of 0.0%), Menominee (94.6%, a difference of 0.0%), Immigrants from Switzerland (94.6%, a difference of 0.0%), Yugoslavian (94.6%, a difference of 0.010%), and South African (94.7%, a difference of 0.080%). Similarly, the demographic groups most similar to Immigrants from Czechoslovakia are Immigrants from Denmark (94.7%, a difference of 0.010%), Immigrants from Latvia (94.7%, a difference of 0.010%), Filipino (94.8%, a difference of 0.030%), Swiss (94.7%, a difference of 0.040%), and Immigrants from Western Europe (94.7%, a difference of 0.040%).
| Demographics | Rating | Rank | 10th Grade |
| Romanians | 99.5 /100 | #76 | Exceptional 94.8% |
| Immigrants | South Africa | 99.5 /100 | #77 | Exceptional 94.8% |
| Filipinos | 99.3 /100 | #78 | Exceptional 94.8% |
| Immigrants | Czechoslovakia | 99.2 /100 | #79 | Exceptional 94.7% |
| Immigrants | Denmark | 99.2 /100 | #80 | Exceptional 94.7% |
| Immigrants | Latvia | 99.2 /100 | #81 | Exceptional 94.7% |
| Swiss | 99.1 /100 | #82 | Exceptional 94.7% |
| Immigrants | Western Europe | 99.1 /100 | #83 | Exceptional 94.7% |
| Icelanders | 99.1 /100 | #84 | Exceptional 94.7% |
| Crow | 99.0 /100 | #85 | Exceptional 94.7% |
| Puget Sound Salish | 99.0 /100 | #86 | Exceptional 94.7% |
| Immigrants | Saudi Arabia | 99.0 /100 | #87 | Exceptional 94.7% |
| Immigrants | Japan | 99.0 /100 | #88 | Exceptional 94.7% |
| Immigrants | Moldova | 98.9 /100 | #89 | Exceptional 94.7% |
| South Africans | 98.8 /100 | #90 | Exceptional 94.7% |
| Whites/Caucasians | 98.8 /100 | #91 | Exceptional 94.7% |
| Yugoslavians | 98.4 /100 | #92 | Exceptional 94.6% |
| Soviet Union | 98.3 /100 | #93 | Exceptional 94.6% |
| Immigrants | Germany | 98.3 /100 | #94 | Exceptional 94.6% |
| Menominee | 98.3 /100 | #95 | Exceptional 94.6% |
| Immigrants | Switzerland | 98.3 /100 | #96 | Exceptional 94.6% |